Quantcast
Channel: Sebastian Solnica – Debug notes
Viewing all 59 articles
Browse latest View live

The truth about app_offline.htm

$
0
0

In this short post I would like to present you am interesting fact about app_offline.htm. Let’s start with a small puzzle. Imagine you have 2 files in your IIS application folder: web.config and app_offline.htm. Web.config contains following lines:

<?xml version="1.0"?>
<configuration>
</configuration

and app_offline.htm:

We'll be back in a moment.

Notice that in the web.config file the configuration tag is not closed. Now the question is: what will you see if you try to access your application from the browser?

I was a bit surprised when I saw HTTP Error 500.19 – Internal Server Error:

500.19 - Internal Server Error

instead of the content of my app_offline.htm file. From the image we can also see that it’s IIS Web Core that generates this error. To understand what happened I needed to find a method in ASP.NET framework that renders this special file. It didn’t take long till I stumbled upon a CheckApplicationEnabled method in the System.Web.HttpRuntime class (decompiled with dotPeek):

internal static void CheckApplicationEnabled()
{
  string str = Path.Combine(HttpRuntime._theRuntime._appDomainAppPath, &quot;App_Offline.htm&quot;);
  bool flag = false;
  HttpRuntime._theRuntime._fcm.StartMonitoringFile(str, new FileChangeEventHandler(HttpRuntime._theRuntime.OnAppOfflineFileChange));
  try
  {
    if (System.IO.File.Exists(str))
    {
      using (FileStream fileStream = new FileStream(str, FileMode.Open, FileAccess.Read, FileShare.Read))
      {
        if (fileStream.Length <= 1048576L)         {           
          int count = (int) fileStream.Length;
          if (count > 0)
          {
            byte[] buffer = new byte[count];
            if (fileStream.Read(buffer, 0, count) == count)
            {
              HttpRuntime._theRuntime._appOfflineMessage = buffer;
              flag = true;
            }
          }
          else
          {
            flag = true;
            HttpRuntime._theRuntime._appOfflineMessage = new byte[0];
          }
        }
      }
    }
  }
  catch
  {
  }
  if (flag)
    throw new HttpException(503, string.Empty);
  if (!RuntimeConfig.GetAppConfig().HttpRuntime.Enable)
    throw new HttpException(404, string.Empty);
}

This method is called either on HttpRuntime initialization or when a special application pool is created.

To summarize, it’s HttpRuntime that generates 503 response code and renders a friendly error message. So if anything happens while HttpRuntime is initializing (missing dlls, invalid configuration file etc.) you won’t see this message but less friendly 500 Internal Error. With IIS 7 and above IIS Web Core module will stop request execution even before it reaches the managed runtime.


Filed under: Diagnosing ASP.NET

ASP.NET MVC bundles internals

$
0
0

The idea of minimizing and combining multiple script and style files into one file has been popular among web developers for quite some time. With the 4th version of ASP.NET MVC Microsoft introduced a mechanism (called bundles) that allow .NET developers to automate and control this process. Although bundles are quite easy to configure and use they might sometimes do not behave as expected. In this post I’m going to acquaint you with bundles internals and present you ways to troubleshoot problems they may generate.

Bundles architecture

To examine bundles let’s create a default ASP.NET MVC project in Visual Studio 2013. This project should have a BundleConfig.cs file in App_Start folder with some bundle routes defined, eg.:

public class BundleConfig
{
    // For more information on bundling, visit http://go.microsoft.com/fwlink/?LinkId=301862
    public static void RegisterBundles(BundleCollection bundles)
    {
        bundles.Add(new ScriptBundle("~/bundles/jquery").Include(
                    "~/Scripts/jquery-{version}.js"));
        ...
    }
}

After the above code is called from Global.asax on Application_Start event a new route will be created and a request to http://localhost:8080/bundles/jquery.js?v=JzhfglzUfmVF2qo-weTo-kvXJ9AJvIRBLmu11PgpbVY1 will render a minimized version of jquery (unless the <compilation> tag does not have the debug attribute set to true). To understand how it works let’s have a look how bundles interact with the ASP.NET pipeline. As we know requests coming to an ASP.NET application need to be served by a handler. At first a default handler is assigned by IIS based on a mask (handlers tag in applicationhost.config). Then the request is processed by all the HTTP modules defined in the configuration files (in the integrated mode a precondition must be also fulfilled). Each module has a chance to change the already assigned handler. Finally the chosen handler processes the request. Starting from .NET4 there is also a possibility to inject HTTP modules into the ASP.NET pipeline dynamically from our application code. For this purpose we need to add a PreApplicationStartMethodAttribute attribute to our assembly. When HTTP runtime detects an assembly with such an attribute it will execute a method the attribute defines before the application start. As we are examining bundles let’s take as an example System.Web.Optimization.dll assembly. It has the following attribute set:

[assembly: PreApplicationStartMethod(typeof (PreApplicationStartCode), "Start")]

And the PreApplicationStartCode class looks as follows:

[EditorBrowsable(EditorBrowsableState.Never)]
public static class PreApplicationStartCode
{
  private static bool _startWasCalled;

  /// <summary>
  /// Hooks up the BundleModule
  /// </summary>
  public static void Start()
  {
    if (PreApplicationStartCode._startWasCalled)
      return;
    PreApplicationStartCode._startWasCalled = true;
    DynamicModuleUtility.RegisterModule(typeof (BundleModule));
  }
}

Notice that the above code registers a new BundleModule in the ASP.NET pipeline:

    public class BundleModule : IHttpModule
    {
      ...
      private void OnApplicationPostResolveRequestCache(object sender, EventArgs e)
      {
        HttpApplication app = (HttpApplication) sender;
        if (BundleTable.Bundles.Count <= 0)
          return;
        BundleHandler.RemapHandlerForBundleRequests(app);
      }
      ...
    }

Remapping happens only if a static file with a name equal to our bundle does not exist:

internal static bool RemapHandlerForBundleRequests(HttpApplication app)
{
  HttpContextBase context = (HttpContextBase) new HttpContextWrapper(app.Context);
  string executionFilePath = context.Request.AppRelativeCurrentExecutionFilePath;
  VirtualPathProvider virtualPathProvider = HostingEnvironment.VirtualPathProvider;
  if (virtualPathProvider.FileExists(executionFilePath) || virtualPathProvider.DirectoryExists(executionFilePath))
    return false;
  string bundleUrlFromContext = BundleHandler.GetBundleUrlFromContext(context);
  Bundle bundleFor = BundleTable.Bundles.GetBundleFor(bundleUrlFromContext);
  if (bundleFor == null)
    return false;
  context.RemapHandler((IHttpHandler) new BundleHandler(bundleFor, bundleUrlFromContext));
  return true;
}

After a BundleHandler is chosen to process a given request it creates a context for bundle operations and examines the BundleTable in search for a bundle that should be sent to the browser. Bundles are cached by their hash so subsequent calls for the same bundle perform much faster than the first one.

IIS configuration for bundles

For simplicity’s sake, I will focus only on Integrated Pipie in IIS7+. You need to be sure that ASP.NET handler is called for your bundle requests, otherwise they won’t be served. If you are using urls in the form of /bundlename?v=bundlehash the default handler configuration in IIS (presented below) should be good.

<handlers>
    ...
    <add name="ExtensionlessUrlHandler-Integrated-4.0" path="*." verb="GET,HEAD,POST,DEBUG" type="System.Web.Handlers.TransferRequestHandler" preCondition="integratedMode,runtimeVersionv4.0" />
    <add name="StaticFile" path="*" verb="*" modules="StaticFileModule,DefaultDocumentModule,DirectoryListingModule" resourceType="Either" requireAccess="Read" />
</handlers>

And in the IIS Failed Request Trace you should see the following events (I marked in red the ones that are related to bundles):

iis bundle request trace

Notice that the ExtensionlessUrlHandler-Integrated-4.0 handler assigned at first by IIS is then replaced by System.Web.Optimization.BundleHandler. We already know that this replacement is ordered by System.Web.Optimization.BundleModule on the RESOLVE_REQUEST_CACHE notification (marked in red on the image).

Troubleshooting problems

So far we examined bundles internals and their correct interaction with the ASP.NET (IIS) pipeline. But what if things go wrong and instead of seeing nicely compacted javascript you receive 404 HTTP response? We had such a problem in production in one of our applications. Just after deploying a new version of this application, bundles were never working (returning 404 code). The only fix we found was to restart the application pool after a deploy. As you can imagine it was less than desirable solution so I started investigating the root cause of our problem. During tests I found out that this problem was appearing only when the application was interrupted with requests during deployment (by, for example, our load balancer which was checking if the application is responding). Example javascript bundle in our application had the following path: bundle/Site.js?v=77xGE3nvrvjxqAXxBT1RWdlpxJyptHaSWsO7rRkN_KU1. Did you notice a subtle difference between this url and the one from the ASP.NET example application? Yes, the .js EXTENSION! This small part of the url changed dramatically the way IIS handled requests for bundles. Till application was ready (fully deployed) IIS tried to serve them using StaticFileHandler (which was in accordance to its handlers mask configuration). Also it appears that IIS caches which modules were run for a given url. Thus, even when our application was ready to serve the bundle requests IIS didn’t run System.Web.Optimization.BundleModule on them. We eventually removed the .js extension from the bundles url. Another solution might have been to change the mask for the ExtensionlessUrlHandler-Integrated-4.0 to *. This would force IIS to run the managed module for all the requests to the application.

If you would like to check which files were included into a bundle you may tamper the request (using for example fiddler) by modifying the User-Agent header to Eureka/1, example request:

GET http://localhost:8080/Content/css?v=WMr-pvK-ldSbNXHT-cT0d9QF2pqi7sqz_4MtKl04wlw1 HTTP/1.1
Host: localhost:8080
Connection: keep-alive
Cache-Control: max-age=0
Accept: text/css,*/*;q=0.1
If-Modified-Since: Sat, 15 Feb 2014 15:52:46 GMT
User-Agent: Eureka/1
Referer: http://localhost:8080/
Accept-Encoding: gzip,deflate,sdch
Accept-Language: en-US,en;q=0.8,pl;q=0.6,fr-FR;q=0.4,fr;q=0.2

and the response:

HTTP/1.1 200 OK
Cache-Control: private
Content-Type: text/css; charset=utf-8
Vary: Accept-Encoding
Server: Microsoft-IIS/8.0
X-AspNet-Version: 4.0.30319
X-SourceFiles: =?UTF-8?B?YzpcdGVtcFxidW5kbGUtdGVzdFxDb250ZW50XGNzcw==?=
X-Powered-By: ASP.NET
Date: Sat, 15 Feb 2014 22:12:52 GMT
Content-Length: 14076

/* Bundle=System.Web.Optimization.Bundle;Boundary=MgAwADcANgAwADIAMwAyADUA; */
/* MgAwADcANgAwADIAMwAyADUA "~/Content/site.css" */
html {
    background-color: #e2e2e2;
    margin: 0;
    padding: 0;
}
...

Summary

I hope that this post helped you better understand ASP.NET bundles. They are a great mechanism to automatically group and minimize script and style files in your application. And if you ever encounter any problems with them remember about IIS Failed Request Trace and Eureka/1 user agent :)


Filed under: CodeProject, Diagnosing ASP.NET

NullReferenceException and MachineKey.Decode

$
0
0

In my recent project I had to sign a http cookie in order to disallow any unauthorized changes to its content. I didn’t want to reinvent the wheel but use something already implemented in ASP.NET – for instance mechanism that is used to sign ViewState content. After some research I found promising methods: System.Web.Security.MachineKey.Encode/Decode (I’m using .NET4, in 4.5 these method are obsolete and new methods: Protect/Unprotect were introduced to replace them). Let’s first look at an example how to use those methods. The below code snippet retrieves content of a signed cookie or prints information that the cookie was tampered:

<%@ Application Language="C#" %>
<%@ Import Namespace="System.Web.Security" %>
<%@ Import Namespace="System.Web.Configuration" %>

<script Language="c#" runat="server">

    void Application_Start(Object sender, EventArgs ev) {
    }

    void Application_BeginRequest(Object sender, EventArgs ev)
    {
        try {
            var cookie = Request.Cookies["_sec"];
            if (cookie != null && !String.IsNullOrEmpty(cookie.Value)) {
                var txt = MachineKey.Decode(cookie.Value, MachineKeyProtection.Validation);
                if (txt == null) {
                    Response.Write("Cookie tampered.");
                } else {
                    Response.Write(Encoding.ASCII.GetString(txt));
                }
            }
        } catch (Exception ex) {
            Response.Write("Exception: " + ex);
        }
    }

    void Application_EndRequest(Object sender, EventArgs ev)
    {
        var signedtxt = MachineKey.Encode(Encoding.ASCII.GetBytes("test string"), MachineKeyProtection.Validation);
        Response.SetCookie(new HttpCookie("_sec", signedtxt));
    }

</script>

With default settings the key, used to sign the cookie, is randomly created by ASP.NET and algorithm to generate the hash is HMACSHA256. You may alter those settings by modifying machineKey section in the web.config file (more on MSDN).

What was a surprise to me after I ran this code was the fact that the first request to my application (with the cookie set) generated NullReferenceException which pointed to the MachineKey.Decode method. I ran the debugger, opened referencesource-beta.microsoft.com and by comparing generated assembly with the original C# code I found a line to blame (highlighted):

    //////////////////////////////////////////////////////////////////
    // Step 3a: Remove the hash from the end of the data
    if (data.Length < MachineKeySection.HashSize)
        return null;

MachineKeySection.HashSize blindly assumes that it is already initialized and tries to retrieve the hashsize from the configuration object (which is null at this point):

    internal static int HashSize { get { s_config.RuntimeDataInitialize(); return _HashSize; } }

Subsequent requests run fine as MachineKey.Encode method initializes s_config properly. But if application reboots the first request will again be “exceptional” :)

I already submitted a bug report on Microsoft connect (https://connect.microsoft.com/VisualStudio/feedback/details/827886/nullreferenceexception-when-machinekey-decode-is-called) so if you happen to encounter this error please upvote my report. For now, as a simple workaround I recommend calling MachineKeySection.EnsureConfig method when your application starts (it is internal so we must use reflection), eg.:

    void Application_Start(Object sender, EventArgs ev) {
        typeof (MachineKeySection).GetMethod("EnsureConfig";, System.Reflection.BindingFlags.Static | System.Reflection.BindingFlags.NonPublic).Invoke(null, null);
    }

A simple ASP.NET application that demonstrates this problem can be found on my blog samples page.


Filed under: Diagnosing ASP.NET

MSMQ helper tools

$
0
0

In today’s short post I would like to present you three tools that I use frequently in diagnosing services that use MS Message Queues. These are:

  • MessageDumper – downloads and removes messages from queue
  • MessagePeeker – downloads but does not remove messages from queue
  • MessagePusher – sends collected messages to a given queue

MessageDumper and MessagePeeker gather messages in batches, storing each batch in a separate file. The size of the batch and the number of files is configurable from the command line. Output files can be then processed by MessagePusher and send to a different queue, for example on a developer’s machine.

Case of diagnostics

Imagine you have a production Windows Service that processes statistics. Statistics are generated by web applications on people actions and sent to your service using MS Message Queues (let’s assume the service queue is private and its name is LowLevelDesign.Stats). Some day you observe that for a specific set of statistics messages your service breaks. In order to debug the issue locally you need those messages. You may then ask your admin to stop the service, wait for the statistics to come and run:

MessagePeeker -q .\private$\LowLevelDesign.Stats -o brokenset 

This command should generate 2 files on output: brokenset.headers and brokenset.1. The first one is a header file which contains information about messages stored in other files. Copy the generated files to your local machine and run:

MessagePusher -q .\private$\LowLevelDesign.Local.Stats -i brokenset

and all the saved messages will be sent to your local queue. As said previously when you have many messages to process you may gather them in batches. The presented tools are available for download on my .NET Diagnostics Toolkit page.


Filed under: Diagnosing Applications on Windows

Stopwatch vs. DateTime

$
0
0

.NET developers usually know they should measure code performance using a Stopwatch class from the System.Diagnostics namespace. From time to time though I see code where someone uses DateTime instances for this purpose. And it’s not very surprising as DateTime class is usually the one that comes to mind when you think of time in .NET. In today’s post I would like to show you the difference in accuracy of both those approaches and the price you need to pay using either of them. We will work on this sample code that does nothing but measure time :):

#define TRACE

using System;
using System.Diagnostics;
using System.Diagnostics.Eventing;
using System.IO;
using System.Linq;
using System.Windows.Forms;
using System.Threading;

public class Class1 {
    public static void Main(String[] args) {
        bool fout = false;
        if (args.Length > 0 && String.Equals(args[0], "-tofiles", StringComparison.OrdinalIgnoreCase)) {
            fout = true;
        }
        const String providerId = "2c0a81aa-1f56-4e36-a4b5-f2e3787f887e";
        const int loop = 100000;

        Trace.Listeners.Clear();
        Trace.Listeners.Add(new EventProviderTraceListener(providerId));

        Console.WriteLine("Stopwatch frequency: {0:#,#} ticks / s", Stopwatch.Frequency);
        Console.WriteLine("DateTime: 10 000 000 ticks / s");
        Console.WriteLine("Loop count: {0:#,#}", loop);

        Console.WriteLine("---------------------------------------------------");

        int i,j,d;
        i = j = d = 0;
        var deltas = new int[loop];
        var times = new long[loop];
        var ldt = DateTime.UtcNow.Ticks;
        var startdt = ldt;
        while (i < loop) {
            var cdt = DateTime.UtcNow.Ticks;
            if (ldt != cdt && i > 2) {
                int delta = (int)(cdt - ldt);
                deltas[i] = delta;
                if (delta > 100) {
                    Trace.TraceInformation("Delta: {0}", delta);
                }
                ldt = cdt;
                d = j;
            } else {
                j++;
            }
            times[i] = cdt;
            i++;
        }
        ldt = DateTime.UtcNow.Ticks;
        Console.WriteLine("DateTime start ticks: {0}", startdt);
        Console.WriteLine("DateTime ticks: {0:#,#} | ms: {1} | missed loop iterations: {2:#,#}", ldt - startdt, (ldt - startdt) / 10000.0, j);
        var q = deltas.Where(e => e > 0);
        if (q.Any()) {
            Console.WriteLine("Timer deltas | min: {0}, max: {1}, avg: {2}", q.Min(), q.Max(), q.Average());
        }
        if (fout) {
            DumpToCsvFile("datetimes.csv", times);
            DumpToCsvFile("datetimes-deltas.csv", deltas);
        }

        Console.WriteLine("---------------------------------------------------");

        i = j = d = 0;
        Array.Clear(deltas, 0, deltas.Length);
        Array.Clear(times, 0, times.Length);
        var sw = new Stopwatch();
        sw.Start();
        var ls = sw.ElapsedTicks;
        var starts = ls;
        while (i < loop) {
            var cs = sw.ElapsedTicks;
            if (ls != cs && i > 2) {
                int delta = (int)(cs - ls);
                deltas[i] = delta;
                if (delta > 100) {
                    Trace.TraceInformation("Delta: {0}", delta);
                }
                ls = cs;
                d = j;
            } else {
                j++;
            }
            times[i] = cs;
            i++;
        }
        ls = sw.ElapsedTicks;
        Console.WriteLine("Stopwatch start ticks: {0}", starts);
        Console.WriteLine("Stopwatch ticks: {0:#,#} | ms: {1} | missed loop iterations: {2:#,#}", ls - starts, (ls - starts) * 1000.0d / Stopwatch.Frequency, j);

        q = deltas.Where(e => e > 0);
        if (q.Any()) {
            Console.WriteLine("Timer deltas | min: {0}, max: {1}, avg: {2}", q.Min(), q.Max(), q.Average());
        }
        if (fout) {
            DumpToCsvFile("stopwatch.csv", times);
            DumpToCsvFile("stopwatch-deltas.csv", deltas);
        }
    }

    private static void DumpToCsvFile<T>(String fname, T[] times) {
        using (var sw = new StreamWriter(fname)) {
            for (int i = 0; i < times.Length; i++) {
                sw.WriteLine("{0,9},{1}", i, times[i]);
            }
        }
    }
 }

Don’t worry if some parts of the code seem strange and unnecessary – I will explain them later. For now let’s focus on two while loops. We simply iterate a given number of times, each time checking if our timer (DateTime.UtcNow.Ticks in the first loop, Stopwatch.ElapsedTicks in the second loop) has changed since last iteration. If it had then we store information about the time increase and if it’s higher than 100 we send a trace event. We skip first two iterations as from my observations they did not provide valid data. After each loop we print on the output the number of passed ticks, their representation in milliseconds and the number of “missed loops” – i.e. loops for which the timer elapsed value hadn’t changed. We also provide information on the minimal, maximal and average recorded time increase. Now, before we look at some statistics I gathered, think what numbers would you expect to see.

Time to measure

My desktop machine, on which I conducted the experiment, is 3-years old and the loop with 100 000 iterations was enough for it – you may need to make the number higher to observe similar results on your hardware. Here is coreinfo output for my desktop (I stripped unnecessary information):

> coreinfo

Pentium(R) Dual-Core  CPU      E5300  @ 2.60GHz
Intel64 Family 6 Model 23 Stepping 10, GenuineIntel
...
Maximum implemented CPUID leaves: 0000000D (Basic), 80000008 (Extended).

Logical to Physical Processor Map:
*-  Physical Processor 0
-*  Physical Processor 1

Logical Processor to Socket Map:
**  Socket 0

Logical Processor to NUMA Node Map:
**  NUMA Node 0

Logical Processor to Cache Map:
*-  Data Cache          0, Level 1,   32 KB, Assoc   8, LineSize  64
*-  Instruction Cache   0, Level 1,   32 KB, Assoc   8, LineSize  64
**  Unified Cache       0, Level 2,    2 MB, Assoc   8, LineSize  64
-*  Data Cache          1, Level 1,   32 KB, Assoc   8, LineSize  64
-*  Instruction Cache   1, Level 1,   32 KB, Assoc   8, LineSize  64

Logical Processor to Group Map:
**  Group 0

And results from three executions of our TestClock.exe appliction:

   PS cpu-lab> .\TestClock.exe
    Stopwatch frequency: 2 539 156 ticks / s
    DateTime: 10 000 000 ticks / s
    Loop count: 100 000
    ---------------------------------------------------
    DateTime start ticks: 635322737464673264
    DateTime ticks: 9 991 | ms: 0,9991 | missed loop iterations: 99 999
    Loop count deltas | min: 42934, max: 42934, avg: 42934
    Timer deltas | min: 9991, max: 9991, avg: 9991
    ---------------------------------------------------
    Stopwatch start ticks: 3
    Stopwatch ticks: 169 436 | ms: 66,7292596437556 | missed loop iterations: 11
    Loop count deltas | min: 11, max: 11, avg: 11
    Timer deltas | min: 1, max: 454, avg: 1,69452639790377

    PS cpu-lab> .\TestClock.exe
    Stopwatch frequency: 2 539 156 ticks / s
    DateTime: 10 000 000 ticks / s
    Loop count: 100 000
    ---------------------------------------------------
    DateTime start ticks: 635322737474030645
    DateTime ticks: 19 995 | ms: 1,9995 | missed loop iterations: 99 998
    Loop count deltas | min: 14710, max: 62555, avg: 38632,5
    Timer deltas | min: 9987, max: 10008, avg: 9997,5
    ---------------------------------------------------
    Stopwatch start ticks: 2
    Stopwatch ticks: 168 041 | ms: 66,1798644904055 | missed loop iterations: 11
    Loop count deltas | min: 11, max: 11, avg: 11
    Timer deltas | min: 1, max: 434, avg: 1,68057486323496

    PS cpu-lab> .\TestClock.exe
    Stopwatch frequency: 2 539 156 ticks / s
    DateTime: 10 000 000 ticks / s
    Loop count: 100 000
    ---------------------------------------------------
    DateTime start ticks: 635322737482013380
    DateTime ticks: 19 995 | ms: 1,9995 | missed loop iterations: 99 998
    Loop count deltas | min: 15856, max: 67295, avg: 41575,5
    Timer deltas | min: 9991, max: 10004, avg: 9997,5
    ---------------------------------------------------
    Stopwatch start ticks: 3
    Stopwatch ticks: 169 051 | ms: 66,577634458064 | missed loop iterations: 11
    Loop count deltas | min: 11, max: 11, avg: 11
    Timer deltas | min: 1, max: 453, avg: 1,69067597435718

First, notice how many loop iterations were required to observe a change in DateTime.UtcNow.Ticks. In 100 000 iterations there were 1-2 changes. The time delta for the system timer depends on the current clock resultion which on my machine at the time of the test was around 1ms. DateTime tick is always 0,0001 ms and you can see that timer deltas for DateTime were around 10 000 ticks. You may check the current clock resolution using clockres (another great tool from sysintenals):

> clockres

ClockRes v2.0 - View the system clock resolution
Copyright (C) 2009 Mark Russinovich
SysInternals - www.sysinternals.com

Maximum timer interval: 15.625 ms
Minimum timer interval: 0.500 ms
Current timer interval: 1.000 ms

Now imagine that for some reason (usually energy consumption) your current clock resolution was set to 15ms. Measuring application code with 15ms accuracy may lead to really bad conclusions on its performance. And that’s the reason why Stopwatch class exists. Stopwatch uses a special High-Frequency Timer which interval on my machine is around 2 Stopwatch ticks (2 * 1 / 2539156 * 1000 * 1000 ~ 0,78 us – 2 539 156 is a Stopwatch frequency on my desktop). For DateTime we had stable ~10 000 ticks deltas, but for Stopwatch 95% deltas were 1-2 ticks with the other 5% reaching values above 100 ticks. In the next paragraph we will investigate further these discrepancies. Another thing from the above output that should attract your attention is the code execution time. Stopwatch loop is almost 30x slower than DateTime one. That shows that frequent querying for elapsed time using Stopwatch is not cost free. Of course we are talking about milliseconds here but keep that in mind.

Going deeper

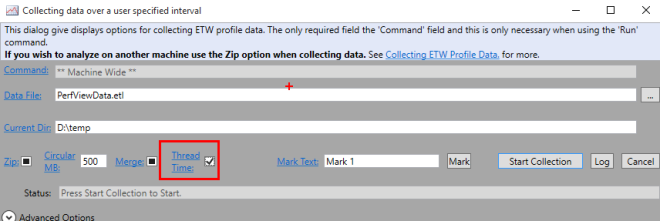
In order to investigate Stopwatch timer delays I prepared a following batch script (based on Andrew Richards CPU wait script). If you don’t have Windows Performance Toolkit installed (which is required to run the script) you may get it from ADK:

@echo off
echo Press a key when ready to start...
pause
echo .
echo ...Capturing...
echo .

xperf -on PROC_THREAD+LOADER+PROFILE+INTERRUPT+DPC+DISPATCHER+CSWITCH -stackwalk Profile+CSwitch+ReadyThread -BufferSize 1024 -MinBuffers 256 -MaxBuffers 256 -MaxFile 256 -FileMode Circular -f kernel.etl

xperf -start clr -on e13c0d23-ccbc-4e12-931b-d9cc2eee27e4:0x1CCBD:0x5+A669021C-C450-4609-A035-5AF59AF4DF18:0xB8:0x5 -f clr.etl

xperf -start myetl -on 2c0a81aa-1f56-4e36-a4b5-f2e3787f887e:0x1F00:0x1F -f my.etl

echo Press a key when you want to stop...
pause
echo .
echo ...Stopping...
echo .

xperf -stop
xperf -stop clr
xperf -stop myetl

xperf -merge kernel.etl clr.etl my.etl cpuwait.etl

del kernel.etl
del clr.etl
del my.etl

We will collect events from Windows kernel provider that describe process/threads states (PROC_THREAD+LOADER+PROFILE+INTERRUPT+DPC+DISPATCHER+CSWITCH), .NET events from .NET Runtime and .NET Rundown providers (those are needed to decode managed stacks) and our custom events from the 2c0a81aa-1f56-4e36-a4b5-f2e3787f887e provider, defined at the beginning of the Main method. As noted previously, anytime we encounter delta bigger than 100 ticks we send an ETW event using this provider. This will help us to find kernel events that happen at the same time. With them we should be able to inspect the source of the timer delays.

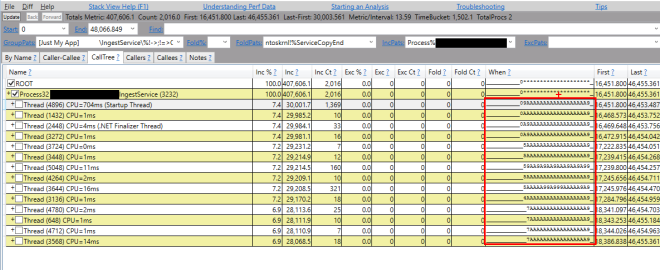
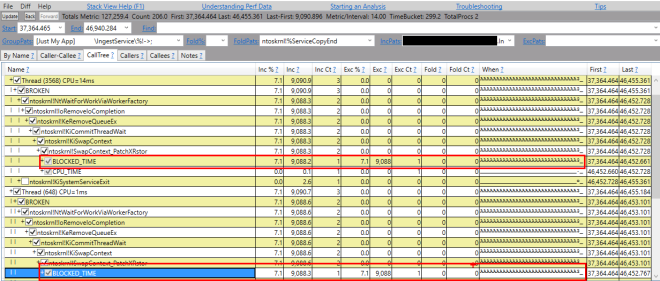
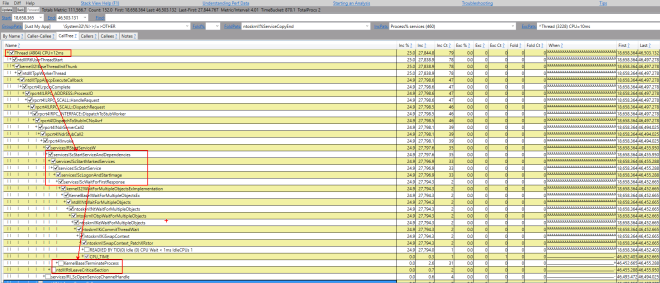
After trace collection I opened the cpuwait.etl file in Windows Perofmance Analyzer and grabbed the Generic events and CPU Precise graphs:

events

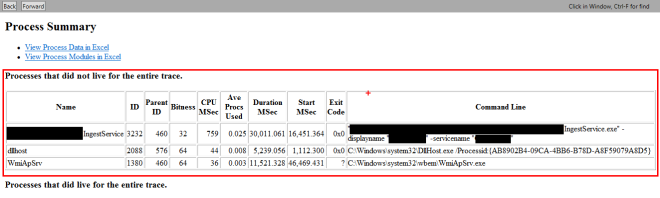
There are two seperate groups of events from our application provider. We may skip the first group as those were generated by DateTime loop and focus on one of the events from the second group (I rearranged columns in the summary table and sorted rows chronologically by SwitchInTime value):
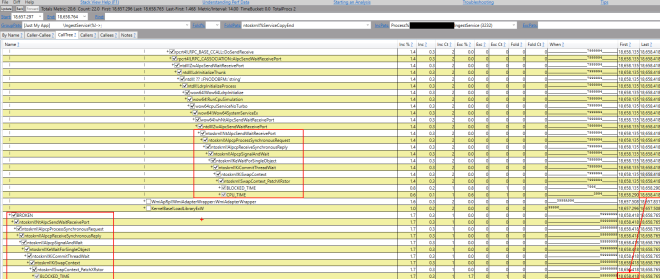
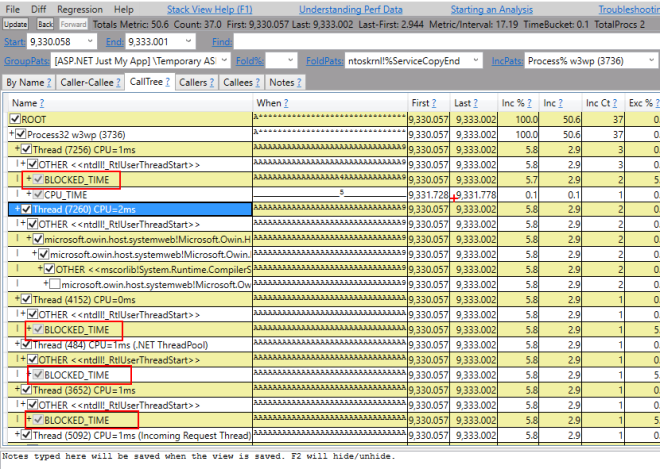
context-switch

The image clearly shows that the delay in stopwatch timer was caused by a context switch in TestClock.exe between two processors. Notice also that the waiting time for the thread to start again equals 113 us which is more than 100 Stopwatch ticks and explains why the event was generated. This also proves that Stopwatch interval frequency is enough even for meticulous code profiling.

If you’d like to perform tests by yourself the WPA profile I used and the source code of the TestClock.exe is available for download on my blog’s codeplex page.


Filed under: CodeProject, Profiling .NET applications

LowLevelDesign.NLog.Ext and ETW targets for NLog

$
0
0

I really like the NLog library and I use it pretty often in my projects. Some time ago I wrote a post in which I showed you my preferred debug and production configuration. Other day I presented you a simple layout renderer for assembly versions. Today, I would like to inform you that all those goodies ;) are available in my brand new LowLevelDesign.NLog.Ext Nuget package.

Additionally, you may find in it two ETW NLog targets. ETW (Event Tracing for Windows) is a very effective way of logging and its support in kernel makes it a great choice for verbose/trace/debug logs. Moreover, if you are using Windows Performance Toolkit in your performance analysis, providing your own ETW messages will help you correlate system events with methods in your application. ETW infrastructure is highly customizable (check Semantic Logging Application Block to see how your logs might look like and how they might be consumed:)).

Our first ETW NLog target is really simple, based on EventProvider from System.Diagnostics.Eventing:

using NLog;
using NLog.Targets;
using System;
using System.Diagnostics.Eventing;

namespace LowLevelDesign.NLog.Ext
{
    [Target("EventTracing")]
    public sealed class NLogEtwTarget : TargetWithLayout
    {
        private EventProvider provider;
        private Guid providerId = Guid.NewGuid();

        /// <summary>
        /// A provider guid that will be used in ETW tracing.
        /// </summary>
        public String ProviderId {
            get { return providerId.ToString(); }
            set {
                providerId = Guid.Parse(value);
            }
        }

        protected override void InitializeTarget() {
            base.InitializeTarget();

            // we will create an EventProvider for ETW
            try {
                provider = new EventProvider(providerId);
            } catch (PlatformNotSupportedException) {
                // sorry :(
            }
        }

        protected override void Write(LogEventInfo logEvent) {
            if (provider == null || !provider.IsEnabled()) {
                return;
            }
            byte t;
            if (logEvent.Level == LogLevel.Debug || logEvent.Level == LogLevel.Trace) {
                t = 5;
            } else if (logEvent.Level == LogLevel.Info) {
                t = 4;
            } else if (logEvent.Level == LogLevel.Warn) {
                t = 3;
            } else if (logEvent.Level == LogLevel.Error) {
                t = 2;
            } else if (logEvent.Level == LogLevel.Fatal) {
                t = 1;
            } else {
                t = 5; // let it be verbose
            }

            provider.WriteMessageEvent(this.Layout.Render(logEvent), t, 0);
        }

        protected override void CloseTarget() {
            base.CloseTarget();

            provider.Dispose();
        }
    }
}

The second one is built on top of the Microsoft.Diagnostics.Tracing Nuget package (by Vance Morrison). Starting from .NET4.5 the EventSource class is available in the framework, but if you want your code to work also with .NET4.0 (as me) you need to use the Nuget package. The code of the extended ETW target is as follows:

using Microsoft.Diagnostics.Tracing;
using NLog;
using NLog.Targets;
using System;

namespace LowLevelDesign.NLog.Ext
{
    [Target("ExtendedEventTracing")]
    public sealed class NLogEtwExtendedTarget : TargetWithLayout
    {
        [EventSource(Name = "LowLevelDesign-NLogEtwSource")]
        public sealed class EtwLogger : EventSource
        {
            [Event(1, Level = EventLevel.Verbose)]
            public void Verbose(String LoggerName, String Message) {
                WriteEvent(1, LoggerName, Message);
            }

            [Event(2, Level = EventLevel.Informational)]
            public void Info(String LoggerName, String Message) {
                WriteEvent(2, LoggerName, Message);
            }

            [Event(3, Level = EventLevel.Warning)]
            public void Warn(String LoggerName, String Message) {
                WriteEvent(3, LoggerName, Message);
            }

            [Event(4, Level = EventLevel.Error)]
            public void Error(String LoggerName, String Message) {
                WriteEvent(4, LoggerName, Message);
            }

            [Event(5, Level = EventLevel.Critical)]
            public void Critical(String LoggerName, String Message) {
                WriteEvent(5, LoggerName, Message);
            }

            public readonly static EtwLogger Log = new EtwLogger();
        }

        protected override void Write(LogEventInfo logEvent)
        {
            if (!EtwLogger.Log.IsEnabled())
            {
                return;
            }
            if (logEvent.Level == LogLevel.Debug || logEvent.Level == LogLevel.Trace) {
                EtwLogger.Log.Verbose(logEvent.LoggerName, Layout.Render(logEvent));
            } else if (logEvent.Level == LogLevel.Info) {
                EtwLogger.Log.Info(logEvent.LoggerName, Layout.Render(logEvent));
            } else if (logEvent.Level == LogLevel.Warn) {
                EtwLogger.Log.Warn(logEvent.LoggerName, Layout.Render(logEvent));
            } else if (logEvent.Level == LogLevel.Error) {
                EtwLogger.Log.Error(logEvent.LoggerName, Layout.Render(logEvent));
            } else if (logEvent.Level == LogLevel.Fatal) {
                EtwLogger.Log.Critical(logEvent.LoggerName, Layout.Render(logEvent));
            }
        }
    }
}

The biggest difference between them is that the second one integrates much better with ETW infrastructure. Thanks to the dynamic manifest generation, events from the second target have more meaningful names and characteristics in tools such as PerfView or WPA:

capture-perfview2

capture-wpa2

compared to events generated by the first target:

capture-perfview1

capture-wpa1

After examining the above output there should be no doubt which target should you use. I recommend NLogEtwExtendedTarget except cases when you need control over GUID of your ETW provider. It’s impossible to change the GUID for LowLevelDesign-NLogEtwSource (EventSources use a well-defined, public mechanism (RFC 4122) for converting a name to a GUID) so logs from applications that use this target will always have the same provider. I don’t consider this a big problem as they are still distinguishable by process id or name.

There is one more thing that should attract your attention in the above screenshots. Have you noticed activity ids for our events? Yes, they are there and it is really easy to enable them. We used to call Trace.CorrelationManager.ActivityId = newActivityId; at the beginning of the activity scope, now we need to make one additional call: EventSource.SetCurrentThreadActivityId(newActivityId, out prevActivityId);. My test application looks as follows:

using System;
using System.Diagnostics;
using NLog;
using LowLevelDesign.NLog.Ext;
using Microsoft.Diagnostics.Tracing;

public static class TestNLog
{
    private static readonly Logger logger = LogManager.GetLogger("TestLogger");

    public static void Main(String[] args) {
        Guid prevActivityId;
        Guid newActivityId = Guid.NewGuid();
        Trace.CorrelationManager.ActivityId = newActivityId;
        EventSource.SetCurrentThreadActivityId(newActivityId, out prevActivityId);

        Console.WriteLine("Trace source logging");

        logger.Info("Start");

        Console.WriteLine("In the middle of tracing");

        logger.ErrorException("Error occured", new Exception("TestException"));

        logger.Info("End");

        EventSource.SetCurrentThreadActivityId(prevActivityId);
        Trace.CorrelationManager.ActivityId = prevActivityId;
    }
}

UPDATE: @Scooletz with his comment inspired me to add a shortcut for scoping traces. The newly added class is named EtwContextScope and is available in version 1.2.1 of the package. The above Main method using it will look as follows:

    public static void Main(String[] args)
    {
        using (new EtwContextScope())
        {
            Console.WriteLine("Trace source logging");

            logger.Info("Start");

            Console.WriteLine("In the middle of tracing");

            logger.ErrorException("Error occured", new Exception("TestException"));

            logger.Info("End");
        }
    }

And its configuration file:

<?xml version="1.0"?>
<configuration>
  <configSections>
    <section name="nlog" type="NLog.Config.ConfigSectionHandler, NLog" />
  </configSections>

  <startup>
    <supportedRuntime version="v4.0" sku=".NETFramework,Version=v4.0" />
  </startup>

  <nlog internalLogToConsole="true" internalLogLevel="Debug" throwExceptions="true">
    <extensions>
      <add prefix="lld" assembly="LowLevelDesign.NLog.Ext" />
    </extensions>
    <targets>
      <target name="console" type="ColoredConsole" layout="${longdate}|${uppercase:${level}}|${message}${onexception:|Exception occurred\:${exception:format=tostring}}" />
      <target name="etw" type="lld.EventTracing" providerId="ff1d574a-58a1-45f1-ae5e-040cf8d3fae2" layout="${longdate}|${uppercase:${level}}|${message}${onexception:|Exception occurred\:${exception:format=tostring}}" />
      <target name="eetw" type="lld.ExtendedEventTracing" layout="${longdate}|${uppercase:${level}}|${message}${onexception:|Exception occurred\:${exception:format=tostring}}" />
    </targets>
    <rules>
      <logger name="TestLogger" minlevel="Debug" writeTo="console" />
      <logger name="TestLogger" minlevel="Debug" writeTo="etw" />
      <logger name="TestLogger" minlevel="Debug" writeTo="eetw" />
    </rules>
  </nlog>
</configuration>

As ETW events are transferred via kernel buffers you need to use special tools or libraries to collect them. You may either create your own solution with a help of the already mentioned Semantic Logging Block or try to use tools such as PerfView or WPR. The screenshot below shows you a PerfView capture window with enabled providers from my test application (notice that we can reference the extended ETW target only by its name):

Capture

If you are looking for information how to use other tools or you want to know more about ETW tracing I recommend a great Vance Morisson’s blog. If you happen to know Polish have a look also at Michał’s post.

All source code from this post is available for download on my codeplex page and my Nuget package waits for you here :)


Filed under: CodeProject, Logging with NLog

Reference Source, dotPeek and source code debugging

$
0
0

Not so long ago Microsoft has made .NET source code browsable through a really nice page: http://referencesource.microsoft.com/. Additionally, they promised that the .NET Framework source code debugging will finally work in Visual Studio. At almost the same time JetBrains published EAP of its dotPeek tool with some great features that make “reverse-engineered debugging” extremely easy. And for other DLLs we still have the old Microsoft Public Symbols server. In this post I am going to show you how I configure my system and Visual Studio for different debugging scenarios.

I will start with some basic information on how symbol files are found and loaded. Most debuggers and diagnostics applications use dbghelp.dll library (provided by Microsoft) to load PDB files. Locations which are examined in order to find PDB files are as follows (keep in mind that the PDB file name must match the DLL file name):

  • the application folder (where the .exe file is located)
  • the folder from which the dll file was loaded (for .NET assemblies it might be for example GAC)
  • C:\WINDOWS\
  • C:\WINDOWS\symbols\dll\
  • C:\WINDOWS\dll
  • Locations pointed by the _NT_SYMBOL_PATH system variable (you can find more information about this variable here)
  • Other locations configured in the debugger

It is worth to have the _NT_SYMBOL_PATH variable set in the system as it is read not only by debuggers but also by tools from Windows Performance Toolkit or sysinternals applications. I have a script which I run on a fresh Windows installation which sets this variable for me:

@echo Setting _NT_SYMBOL_PATH...

@setx /M _NT_SYMBOL_PATH SRV*C:\symbols\dbg*http://referencesource.microsoft.com/symbols;SRV*C:\symbols\dbg*http://msdl.microsoft.com/download/symbols

@echo Setting _NT_SYMCACHE_PATH...

@setx /M _NT_SYMCACHE_PATH c:\symbols\xperf

:: and for the current session also
@set "_NT_SYMBOL_PATH=SRV*C:\symbols\dbg*http://referencesource.microsoft.com/symbols;SRV*C:\symbols\dbg*http://msdl.microsoft.com/download/symbols"

@set "_NT_SYMCACHE_PATH=c:\symbols\xperf"

_NT_SYMCACHE_PATH, which appears in the above script, is another system variable which points to a symbols cache used by profilers from Windows Performance Toolkit. Visual Studio is aware of the _NT_SYMBOLS_PATH variable which is visible in the debugging options pane:

Symbols options in VS

Let’s now examine different debugging scenarios when you would like to adjust symbols loading settings.

Debugging my application code

It is quite common while debugging that you are not interested in assemblies which do not belong to your application and you don’t have time to wait till symbol files for all the modules get loaded. Visual Studio team has thought of this scenario and provided you with an option Enable just My Code in the debugger settings:

Capture

Keep in mind though that setting this checkbox will make your debugger skip loading symbols for .NET Framework assemblies (and some external libraries) and in case of an exception, the call stack window won’t show you the exact location where the exception was thrown:

callstack external

Debugging .NET Framework source code

In times when you would like to step through the .NET Framework code you need to change few settings in the Visual Studio debugger as it is explained here. Unfortunately updates to .NET Framework often break this functionality. In case a symbol file was not loaded for an assembly, you can verify which locations Visual Studio has checked – just right click on the module and choose Symbol Load Information… in the Modules dialog (Debug->Windows->Modules). The output will be similar to the one below:

D:\Users\...\bin\Debug\System.IdentityModel.pdb: Cannot find or open the PDB file.
C:\WINDOWS\Microsoft.Net\assembly\GAC_MSIL\System.IdentityModel\v4.0_4.0.0.0__b77a5c561934e089\System.IdentityModel.pdb: Cannot find or open the PDB file.
C:\WINDOWS\System.IdentityModel.pdb: Cannot find or open the PDB file.
C:\WINDOWS\symbols\dll\System.IdentityModel.pdb: Cannot find or open the PDB file.
C:\WINDOWS\dll\System.IdentityModel.pdb: Cannot find or open the PDB file.
C:\Symbols\dbg\System.IdentityModel.pdb\be517440cdd24a25b0fad1eefd33553b1\System.IdentityModel.pdb: Cannot find or open the PDB file.
C:\Symbols\dbg\MicrosoftPublicSymbols\System.IdentityModel.pdb\be517440cdd24a25b0fad1eefd33553b1\System.IdentityModel.pdb: Cannot find or open the PDB file.
SYMSRV:  C:\symbols\dbg\System.IdentityModel.pdb\BE517440CDD24A25B0FAD1EEFD33553B1\System.IdentityModel.pdb not found
SYMSRV:  http://referencesource.microsoft.com/symbols/System.IdentityModel.pdb/BE517440CDD24A25B0FAD1EEFD33553B1/System.IdentityModel.pdb not found
SRV*C:\symbols\dbg*http://referencesource.microsoft.com/symbols: Symbols not found on symbol server.
SYMSRV:  C:\symbols\dbg\System.IdentityModel.pdb\BE517440CDD24A25B0FAD1EEFD33553B1\System.IdentityModel.pdb not found
SYMSRV:  http://msdl.microsoft.com/download/symbols/System.IdentityModel.pdb/BE517440CDD24A25B0FAD1EEFD33553B1/System.IdentityModel.pdb not found
SRV*C:\symbols\dbg*http://msdl.microsoft.com/download/symbols: Symbols not found on symbol server.
SYMSRV:  C:\Symbols\dbg\System.IdentityModel.pdb\BE517440CDD24A25B0FAD1EEFD33553B1\System.IdentityModel.pdb not found
SYMSRV:  http://msdl.microsoft.com/download/symbols/System.IdentityModel.pdb/BE517440CDD24A25B0FAD1EEFD33553B1/System.IdentityModel.pdb not found
http://msdl.microsoft.com/download/symbols: Symbols not found on symbol server.

As you can see, when I was debugging my application Visual Studio wasn’t able to find the System.IdentityModel.pdb file in Microsoft symbol servers. Fortunately, thanks to dotPeek, you still can fix this situation – I will show you how in the next paragraph.

Debugging external assemblies

Here we will deal with a situation when we don’t have valid PDB files for our modules but still would like to debug source code of the external library (or .NET Framework assembly if default settings do not work). First, go and grab EAP version of dotPeek. Run it and open the Options window. Go to Symbol Server and check Assemblies opened in the Assembly Explorer:

dotpeek-symbol-server

Other options are also cool but usually will slow down your debugger considerably. Now drag assemblies you would like to debug into the Assembly Explorer and press Start Symbol Server button in the toolbar. It’s time to make use of our brand new Symbol Server in Visual Studio. If you haven’t set the _NT_SYMBOL_PATH variable in your system you just need to add http://localhost:33417 to the symbol file locations in the debugger options and uncheck “Microsoft Symbol Servers” (otherwise you will get public symbols from Microsoft for .NET assemblies):

vs-symbols

If you have set the _NT_SYMBOL_PATH you will need to modify it by adding SRV*http://localhost:33417; at the beginning so this location is searched as the first one and no symbol caching is applied. Also remember to Empty the symbols cache. If Visual Studio finds a PDB file in it your symbols server will never be called.

Visual Studio plugin

I wrote a very simple VS plugin – first in my life. If you decide to install it, it will be probably the ugliest one you have :). It contains just four buttons which will switch your symbols settings to one of the previously mentioned configurations. The plugin looks as follows:

debugging-belt

If you are not scared you can grab it from here. Unfortunately, when you would like to switch from MS symbols to dotPeek and vice versa you need to do this when the debugger is not running. I also observed that the debugger engine sometimes switches to new settings on a second run – don’t know whether it’s my fault or a bug in Visual Studio.

Whether you manually configure symbols or use my hardcore plugin I wish you happy resolving :)


Filed under: CodeProject, PDB files usage

ASP.NET Anti-Forgery Tokens internals

$
0
0

Anti-Forgery Tokens were introduced in ASP.NET in order to prevent Cross-Site Request Forgeries. There are many sites which describe how to use and configure those tokens in your application. But in this post I’m going to show you what exactly those tokens contain, where they are generated and how to customize them.

Let’s start our journey from a sample Razor HTTP form:

...
@using (Html.BeginForm()) {
    @Html.AntiForgeryToken()
    @Html.TextBoxFor(m => m.Name)<br />
    @Html.TextBoxFor(m => m.FullName)<br />
    <br />
    <input type="submit" value="Test" />
}
...

As you can see we are generating the token when the page is rendered. In the browser it appears as just another hidden input in the form:

    <input name="__RequestVerificationToken" type="hidden" value="i411mJIr0mZKrk17g4Hf-0_G6aXOJLkzzGfd5yn2mVsTqj-35j_n0YUUCzFRXoFet3BXUVpBicpL3p-AqPPA3XEXEtykt4X-_MbRIxLQH6M1" />

Also if you look at the cookies set on the server response you should see a cookie with a name starting from __RequestVerificationToken:

anti-forgery-cookie

The value from the input field (called Form Token) and from the cookie (called Cookie or Session Token) are correlated and both are required for a successful request validation. The System.Web.Helpers.AntiForgery class is used to generate both those tokens. This class under the hood uses System.Web.Helpers.AntiXsrf.AntiForgeryWorker and creates an instance of it at the initialization:

    private static readonly AntiForgeryWorker _worker = CreateSingletonAntiForgeryWorker();

    private static AntiForgeryWorker CreateSingletonAntiForgeryWorker()
    {
        // initialize the dependency chain

        IAntiForgeryConfig config = new AntiForgeryConfigWrapper();
        IAntiForgeryTokenSerializer serializer = new AntiForgeryTokenSerializer(MachineKey45CryptoSystem.Instance);
        ITokenStore tokenStore = new AntiForgeryTokenStore(config, serializer);
        IClaimUidExtractor claimUidExtractor = new ClaimUidExtractor(config, ClaimsIdentityConverter.Default);
        ITokenValidator tokenValidator = new TokenValidator(config, claimUidExtractor);

        return new AntiForgeryWorker(serializer, config, tokenStore, tokenValidator);
    }

One method in the AntiForgeryWorker class is especially interesting for us: void GetTokens(HttpContextBase httpContext, AntiForgeryToken oldCookieToken, out AntiForgeryToken newCookieToken, out AntiForgeryToken formToken). As its name suggests, it is responsible for retrieving tokens for further processing. Under the hood it is using System.Web.Helpers.AntiXsrf.TokenValidator to generate token values.

Cookie/Session Token

The Cookie Token contains a token version, randomly generated byte array (16 bytes long) called Security Token and a boolean flag set to 1 (which indicates it’s a session token). The Security Token array is then encrypted and encoded using Base64UrlToken encoding and stored in a session cookie with the HttpOnly attribute set (so you can’t access it from JavaScript code). Our sample cookie has a value of Aq81hoVCPIpq3Q6xjBi0EFKKwSFwnKROgS7tyXF393eAN8rdMNZwkVkEgjQokKviKLVST1iWdgDxBt-g3FIughAsczUO7tyWhtz3fs88xMM1, which after decoding and decrypting (BitConverter.ToString(System.Web.Helpers.AntiXsrf.MachineKey45CryptoSystem.Instance.Unprotect("Aq81hoVCPIpq3Q6xjBi0EFKKwSFwnKROgS7tyXF393eAN8rdMNZwkVkEgjQokKviKLVST1iWdgDxBt-g3FIughAsczUO7tyWhtz3fs88xMM1"))) gives: 01-1A-CF-C9-ED-F1-3E-1E-7D-C9-9E-BE-90-2E-22-91-36-01. The token version is 0x1 (the first byte) and we can see that it’s a session token (the last byte).

The last thing I need to mention when describing Cookie Tokens is the name of the cookie which contains our token. It might be sometimes the source of troubles when we transfer anti-forgery tokens between applications (I will write about it later on). In our sample the cookie name is __RequestVerificationToken_L3NoYXJlZC1zZWN1cmVk0. If we decode the L3NoYXJlZC1zZWN1cmVk0 part (System.Text.Encoding.UTF8.GetString(HttpServerUtility.UrlTokenDecode("L3NoYXJlZC1zZWN1cmVk0"))) we will receive: /shared-secured which is the name of a virtual directory my application runs in. If we would like to change the name of the cookie we can do so by adding the following code to, for instance, the Application_Start event handler:

AntiForgeryConfig.CookieName = "__RequestVerificationToken" + "_" + HttpServerUtility.UrlTokenEncode(Encoding.UTF8.GetBytes("/shared-secured"));

This might come in handy when you have two applications under different virtual directories (but under the same domain) and you would like them to share anti-forgery tokens.

Form Token

Compared to Cookie Tokens, Form tokens contain additionally information about the currently logged user as well as optional additional data. Let’s examine the Form Token from my sample output: i411mJIr0mZKrk17g4Hf-0_G6aXOJLkzzGfd5yn2mVsTqj-35j_n0YUUCzFRXoFet3BXUVpBicpL3p-AqPPA3XEXEtykt4X-_MbRIxLQH6M1. After decoding and decrypting (BitConverter.ToString(System.Web.Helpers.AntiXsrf.MachineKey45CryptoSystem.Instance.Unprotect("Aq81hoVCPIpq3Q6xjBi0EFKKwSFwnKROgS7tyXF393eAN8rdMNZwkVkEgjQokKviKLVST1iWdgDxBt-g3FIughAsczUO7tyWhtz3fs88xMM1"))) we receive: 01-1A-CF-C9-ED-F1-3E-1E-7D-C9-9E-BE-90-2E-22-91-36-00-00-00-00. As you can see there are three additional bytes at the end: first byte is a flag desribing if the next field is a 256-bit claims uid – otherwise the next field is a username; second byte should be the first byte of either a claims uid or a username; third byte is an additional data string (empty in our case). When I generated the token I wasn’t authenticated in the application that’s why the username/claims uid byte is empty. Let’s see how this token will look like when a user is authenticated. I created a simple ASP.NET MVC app with the default authentication (based on ASP.NET IdentityModel). The generated token was as follows: a3UA13kXQWK2rlYwCPk-jQdQiaz1aAIwDk0RQkgEsXrEv5j4HTbnH6LLqxKoXcLJ9CUcTs60sc4WmSMVfjDtD8fBx9NYh1qxlWZdxk1LY-UHhTRn97UN_HKCdJAZK5XtC130pbmFmuIOtirDSake_g2. After decoding and decrypting we have: 01-D8-80-F5-14-1F-5B-ED-2E-6E-A5-9D-61-A4-7E-3E-14-00-01-60-C6-BF-36-93-9B-24-A7-55-49-70-0A-CB-05-31-29-8E-93-E6-5C-A5-33-EF-13-F6-92-8D-2F-B7-A7-05-24-00. I mark in bold the interesting part (the unbolded part as you remember is the encoded Security Token). The first byte of the bolded section indicates that next bytes contain a claims uid. The anti-forgery mechanism by default uses two claims:

I then serialized each string using BinaryWriter, combined their binary representations together and computed SHA256 hash:

PS anti-forgery> .\BinarySerializer.exe test.bin http://schemas.xmlsoap.org/ws/2005/05/identity/claims/nameidentifier e250fb73-401a-4dfc-8881-e77d0a04ac85 http://schemas.microsoft.com/accesscontrolservice/2010/07/claims/identityprovider "ASP.NET Identity"

PS anti-forgery> [BitConverter]::ToString($a.ComputeHash([IO.File]::ReadAllBytes("test.bin")))
60-C6-BF-36-93-9B-24-A7-55-49-70-0A-CB-05-31-29-8E-93-E6-5C-A5-33-EF-13-F6-92-8D-2F-B7-A7-05-24

BinaryWriter.exe is a very simple application that generates a binary file from strings passed in arguments:

using System;
using System.IO;

public class Program
{
    public static void Main(String[] args) {
        if (args.Length < 2) {
            Console.WriteLine("Usage: BinarySerializer.exe <output-file> <string1> [<string2> <string3> ...]");
            return;
        }
        using (var fs = new FileStream(args[0], FileMode.Create)) {
            using (var bw = new BinaryWriter(fs)) {
                for (int i = 1; i < args.Length; i++) {
                    bw.Write(args[i]);
                }
            }
        }
    }
}

As you can see in the command line output our generated hash matches the one from the token. If you are not using default claims for authentication, you will need to define your unique claim type somewhere in your application initialization code:

AntiForgeryConfig.UniqueClaimTypeIdentifier = "urn:myuniqueidentityclaim"

The generated hash will then be built from two serialized strings: your claim type name and its value.

Common issues

The required anti-forgery cookie “__RequestVerificationToken_xxxxxxx” is not present.

This one is quite straightforward and indicates that there was no Cookie Token found that would match the Form Token sent in the request. Make sure that the application uses a valid cookie name (you can change it using AntiForgeryConfig.CookieName) and the client has cookies enabled.

The anti-forgery token could not be decrypted. If this application is hosted by a Web Farm or cluster, ensure that all machines are running the same version of ASP.NET Web Pages and that the <machineKey> configuration specifies explicit encryption and validation keys. AutoGenerate cannot be used in a cluster.

This one is more tricky and it may indicate all kinds of problems. If you have two application sharing an Anti-Forgery token, make sure they have the same machineKey configuration and share the cookie name. If user is authenticated when sending the form, make sure you use the same identity claims in both applications. Finally, check if Security Token stored in a Cookie Token matches the one in a Form Token.

I hope information presented in this post will help you better understand ASP.NET anti-forgery tokens and make diagnosing anti-forgery issues easier :)


Filed under: ASP.NET Security, CodeProject

Collect .NET applications traces with sysinternals tools

$
0
0

In this short post I would like to show you how, with sysinternals tools, you may noninvasively trace .NET applications. This is especially useful in production environment where you can’t install your favorite debugger and hang whole IIS to diagnose an issue. We will work with three tools: dbgview, procdump and procmon. Let’s start with the first one.

DebugView (dbgview.exe)

According to its description on sysinternals site: “DebugView is an application that lets you monitor debug output on your local system, or any computer on the network that you can reach via TCP/IP.”. DebugView captures text messages sent by OutputDebugString and DbgPrint Win32Api methods. Interestingly .NET’s DefaultTraceListener under the hood posts trace messages using the OutputDebugString method. So by enabling .NET trace sources we could have a peak at how the application interacts with .NET Framework APIs. Some interesting trace source names are (based on http://msdn.microsoft.com/en-us/library/ty48b824.aspx):

- System.Net – traces from some public methods of the HttpWebRequest, HttpWebResponse, FtpWebRequest and FtpWebResponse classes, and SSL debug information (invalid certificates, missing issuers list and client certificate errors)
System.Net.Sockets – traces from some public methods of the Socket, TcpListener, TcpClient, and Dns classes
System.Net.HttpListener – traces from some public methods of the HttpListener, HttpListenerRequest and HttpListenerResponse
System.Net.Cache – traces from some private and internal methods in System.Net.Cache
System.Net.Http – traces from some public methods of the HttpClient, DelegatingHandler, HttpClientHandler, HttpMessageHandler, MessageProcessingHandler, and WebRequestHandler classes
System.Net.WebSockets – traces from some public methods of the ClientWebSocket and WebSocket classes
Microsoft.Owin – traces from Owin infrastructure in recent ASP.NET applications
System.IdentityModel – Windows Identity Foundation traces
System.Runtime.Serialization – runtime serializers logs
System.ServiceModel – logs all stages of WCF processing, whenever configuration is read, a message is processed in transport, security processing, a message is dispatched in user code, and so on
System.ServiceModel.MessageLogging – logs all messages that flow through the system
System.ServiceModel.Activation – WCF activation logs

REMARK: I mentioned WCF traces above, but they have some specific switch settings which I won’t describe in this post – if you need to work with WCF traces read this MSDN article.

We will see how to collect .NET traces by examining a sample erroneous situation I ran into in one of our applications. We implemented a Google authentication based on Microsoft.Owin.Security.Google. Unfortunately on our test server the application was not able to authenticate the user – only the external authentication cookie was set. I couldn’t run Fiddler on the server so I added following lines to the application web.config file:

    <system.diagnostics>
        <trace autoflush="true" />
        <sharedListeners>
        </sharedListeners>
        <sources>
            <source name="Thinktecture.IdentityModel" switchValue="Verbose">
            </source>
            <source name="System.IdentityModel" switchValue="Verbose">
            </source>
            <source name="Microsoft.Owin" switchValue="Verbose">
            </source>
            <source name="System.Net" switchValue="Verbose">
            </source>
        </sources>
    </system.diagnostics>

Then I ran dbgview.exe as an administrator and select Capture Global Win32 from the Capture menu. When I tried to sign in with Google again traces started to appear. Below you may find a snippet of the output (I used x to hide sensitive info):

00000005	0.01719604	[5280] System.Net Verbose: 0 :
00000006	0.01721783	[5280] [8136] Exiting HttpWebRequest#32103595::HttpWebRequest()
00000007	0.01734075	[5280] System.Net Verbose: 0 :
00000008	0.01738405	[5280] [8136] HttpWebRequest#32103595::HttpWebRequest(uri: 'https://accounts.google.com/o/oauth2/token', connectionGroupName: '9777040')
00000009	0.01745697	[5280] System.Net Verbose: 0 :
00000010	0.01747121	[5280] [8136] Exiting HttpWebRequest#32103595::HttpWebRequest()
00000011	0.03358723	[5280] System.Net Verbose: 0 :
00000012	0.03368026	[5280] [8136] HttpWebRequest#32103595::BeginGetRequestStream()
00000013	0.03388838	[5280] System.Net Verbose: 0 :
00000014	0.03393281	[5280] [8136] ServicePoint#40870089::ServicePoint(accounts.google.com:443)
00000015	0.03459155	[5280] System.Net Information: 0 :
00000016	0.03465440	[5280] [8136] Associating HttpWebRequest#32103595 with ServicePoint#40870089
00000017	0.03490024	[5280] System.Net Information: 0 :
00000018	0.03493740	[5280] [8136] Associating Connection#19415024 with HttpWebRequest#32103595
00000019	0.04254256	[5280] System.Net Verbose: 0 :
00000020	0.04256323	[5280] [8136] Exiting HttpWebRequest#32103595::BeginGetRequestStream()  -> ContextAwareResult#40053370
00000021	0.06268339	[5280] System.Net Information: 0 :
00000022	0.06276719	[5280] [2988] Connection#19415024 - Created connection from x.x.x.x:59905 to 173.194.70.84:443.
00000023	0.06294571	[5280] System.Net Information: 0 :
00000024	0.06302002	[5280] [2988] TlsStream#43170133::.ctor(host=accounts.google.com, #certs=0)
00000025	0.06314965	[5280] System.Net Information: 0 :
00000026	0.06323793	[5280] [2988] Associating HttpWebRequest#32103595 with ConnectStream#64411991
00000027	0.06338710	[5280] System.Net Information: 0 :
00000028	0.06345862	[5280] [2988] HttpWebRequest#32103595 - Request: POST /o/oauth2/token HTTP/1.1
00000029	0.06345862	[5280]
00000030	0.06362708	[5280] System.Net Information: 0 :
00000031	0.06370223	[5280] [2988] ConnectStream#64411991 - Sending headers
00000032	0.06370223	[5280] {
00000033	0.06370223	[5280] Content-Type: application/x-www-form-urlencoded
00000034	0.06370223	[5280] Host: accounts.google.com
00000035	0.06370223	[5280] Content-Length: 299
00000036	0.06370223	[5280] Expect: 100-continue
00000037	0.06370223	[5280] Connection: Keep-Alive
00000038	0.06370223	[5280] }.
...
0.65584564	[5280] [8136] ConnectStream#64411991::BeginWrite()
00000107	0.65595937	[5280] System.Net Verbose: 0 :
00000108	0.65602893	[5280] [8136] Data from ConnectStream#64411991::BeginWrite
00000109	0.65620744	[5280] System.Net Verbose: 0 :
00000110	0.65627921	[5280] [8136] 00000000 : 67 72 61 6E 74 5F 74 79-70 65 3D 61 75 74 68 6F : grant_type=autho
00000111	0.65640384	[5280] System.Net Verbose: 0 :
00000112	0.65647143	[5280] [8136] 00000010 : 72 69 7A 61 74 69 6F 6E-5F 63 6F 64 65 26 63 6F : rization_code&co
00000113	0.65660554	[5280] System.Net Verbose: 0 :
00000114	0.65667343	[5280] [8136] 00000020 : 64 65 XX XX XX XX XX XX-XX XX XX XX XX XX XX XX : de=xxxxxxxxxxxxx
00000115	0.65679383	[5280] System.Net Verbose: 0 :
00000122	0.65743381	[5280] [8136] 00000060 : XX XX XX 26 72 65 64 69-72 65 63 74 5F 75 72 69 : xxx&redirect_uri
00000123	0.65756148	[5280] System.Net Verbose: 0 :
...
00000220	0.75980693	[5280] Microsoft.Owin.Security.Google.GoogleOAuth2AuthenticationMiddleware Error: 0 :
00000221	0.75987005	[5280] Authentication failed
00000222	0.75987005	[5280] System.Net.Http.HttpRequestException: Response status code does not indicate success: 400 (Bad Request).
...

As you can see, in verbose mode whole HTTP requests are logged – with the trace from dbgview it was easy to conclude that our application was sending an invalid redirect uri to Google when generating authentication token.

ProcDump and Process Monitor (procmon.exe)

Another great tool to diagnose applications on production is procdump. Its main purpose is to create dumps in different buggy situations, but today I will focus only on its logging capabilities. You may not know but procdump has a special mode in which no dumps are collected but profiling messages are sent to procmon. You enable this mode with following switches: -f “” -e 1. I usually also add -l switch which makes procdump collect debug log output of our application (i.e. traces I described in the previous paragraph). Procdump is a bit more invasive than dbgview as it attaches itself (as a debugger) to the examined process, but it shouldn’t have a big impact on your application performance.

Let’s have a look at an example. Attach procdump to some buggy application:

PS windows> procdump -e 1 -f "" -l ExceptionTest.exe

Then run procmon and make sure that you included events from: your application, procdump.exe and procdump64.exe (for x64 machines):

procmon-filters

Procmon is itself an excellent diagnosing tool and exception logs from procdump make it even more usable. With these logs you should be able to correlate exceptions in your application with system events (such as I/O, registry or network operations). I need to mention that procdump logs appear in procmon as Profiling Events so remember to enable them:

procmon

I hope hints presented in this post will help you in your own diagnosing battles :) And if you know any .NET trace sources that I’ve forgotten in my list, please write them in comments and I will add them.


Filed under: CodeProject, Effective logging and tracing in .NET

Common authentication/authorization between .NET4.0 and .NET4.5 web applications

$
0
0

ASP.NET Identity is a big step forward and we should profit from its features, such as: two-step authentication, support for OpenId providers, stronger password hashing and claims usage. One of its requirements is .NET4.5 which might be a blocker if you have in your farm legacy Windows 2003 R2 servers still hosting some of your MVC4 (.NET4.0) applications. In this post I would like to show you how you may implement common authentication and authorization mechanisms between them and your new ASP.NET MVC5 (and .NET4.5) applications deployed on newer servers. I assume that your apps have a common domain and thus are able to share cookies.

Back in MVC4 times you probably were using forms authentication and membership roles to authorize users trying to call actions on the controllers. ASP.NET MVC5 still supports this way of securing web applications so we could achieve our goal by enabling forms/membership settings in web.config. I’m not a big fan of this solution as it won’t allow us to use more secure and feature-rich security model introduced in a new version of the framework. What I’m proposing is to use ASP.NET Identity with the Owin security pipeline in new applications and slightly modified forms authentication in older apps. Authorization should be based on claims. Our sample solution will include two applications: IdentityAuth – the MVC5 application and MembershipAuth – a legacy .NET4.0 application.

ASP.NET Identity application (IdentityAuth)

It’s a slightly modified template of the default ASP.NET MVC5 application. We will enable CookieAuthenticationMiddleware to persist user authentication data between requests:

namespace IdentityAuth
{
    public partial class Startup
    {
        // For more information on configuring authentication, please visit http://go.microsoft.com/fwlink/?LinkId=301864
        public void ConfigureAuth(IAppBuilder app)
        {
            // Enable the application to use a cookie to store information for the signed in user
            app.UseCookieAuthentication(new CookieAuthenticationOptions
            {
                AuthenticationType = DefaultAuthenticationTypes.ApplicationCookie,
                LoginPath = new PathString("/Account/Login"),
                CookieSecure = CookieSecureOption.Never,
                Provider = new CookieAuthenticationProvider { }
            });
        }
    }
}

AccountController has only Login, Index and Logout actions defined. The Login action accepts only two accounts: test and admin (normally you would use an instance of the UserManager class to validate user accounts). Additionally test account has a special usertype claim added, which we will use in the authorization logic:

[HttpPost]
public ActionResult Login(LoginModel model)
{
    if (!String.Equals(model.Login, "test", StringComparison.Ordinal) && !String.Equals(model.Login, "admin", StringComparison.Ordinal) ||
        !String.Equals(model.Password, "1234", StringComparison.Ordinal)) {
        return new HttpStatusCodeResult(HttpStatusCode.Unauthorized);
    }

    var identity = new GenericIdentity(model.Login, "ApplicationCookie");
    var claims = new Claim[0];
    if (model.Login.Equals("test", StringComparison.Ordinal))
    {
        claims = new[] { new Claim("urn:usertype", "king") };
    }
    var claimsIdentity = new ClaimsIdentity(identity, claims);

    AuthenticationManager.SignIn(new AuthenticationProperties() { }, claimsIdentity);
    SetFormsAuthCookie(claimsIdentity);

    return RedirectToAction("Index");
}

Next to the usual AuthenticationManager.SignIn (which authenticates user in Owin-based apps) we also call SetFormsAuthCookie. This is a method which will set a forms cookie compatible with our legacy application:

UPDATE 2014.09.16: to make the auth cookie smaller I replaced the previous serialization code with more concise one

private void SetFormsAuthCookie(ClaimsIdentity identity) {
    // we need to serialize claims to string then create an auth ticket
    var cookie = FormsAuthentication.GetAuthCookie(identity.Name, false);
    var authTicket = FormsAuthentication.Decrypt(cookie.Value);
    Debug.Assert(authTicket != null, "authTicket != null");
    authTicket = new FormsAuthenticationTicket(authTicket.Version, authTicket.Name,
        authTicket.IssueDate, authTicket.Expiration,
        authTicket.IsPersistent,
        ExtractUserData(identity),
        authTicket.CookiePath);
    cookie.Value = FormsAuthentication.Encrypt(authTicket);
    // and place it in authorization cookie
    response.SetCookie(cookie);
}

private static String ExtractUserData(ClaimsIdentity identity)
{
    var buffer = new StringBuilder();
    var sw = new StringWriter(buffer);
    using (var jsonWriter = new JsonTextWriter(sw))
    {
        jsonWriter.WriteStartObject();
        foreach (var c in identity.Claims)
        {
            if (claims.Contains(c.Type))
            {
                jsonWriter.WritePropertyName(c.Type);
                jsonWriter.WriteValue(c.Value);
            }
        }
        jsonWriter.WriteEndObject();
    }

    return buffer.ToString();
}

Notice that in the user data section of the authentication ticket we store serialized user claims. Logout action is really simple:

public ActionResult Logout()
{
    AuthenticationManager.SignOut();
    FormsAuthentication.SignOut();

    return RedirectToAction("Login");
}

Last part of the IdentityAuth application that requires some explanation is the configuration file, especially system.web section:

  <system.web>
    <machineKey compatibilityMode="Framework20SP2" validationKey="a4c44e321ad34e783fbcc8dd58d469577097e0cef52beba39a36dc11996e06d2d8603f2155975bc22fd9367c4d66f7ff80101ad5a3339fad002d0aaadf5f6bdb" decryptionKey="31ce2f55ebf54100519d55ad62e9d93ffec98ccd8c7fcea2b6f8f1ff5a7db86c" validation="HMACSHA256" decryption="AES" />
    <compilation debug="true" targetFramework="4.5"/>
    <httpRuntime targetFramework="4.5"/>
    <customErrors mode="Off" />

    <authentication mode="None">
      <forms loginUrl="~/Account/Login" name="testauth" timeout="2880" ticketCompatibilityMode="Framework40" enableCrossAppRedirects="false" />
    </authentication>
  </system.web>

We set the authentication mode to None as we are using the Owin authentication middleware, but at the same time we configure forms authentication – these settings must be the same as in our legacy application. Notice also that machineKey has the compatibilityMode set to Framework20SP2.

Forms/Membership application (MembershipAuth)

Let’s now focus on the .NET4.0 application which needs to understand the authentication context we’ve just configured. We will start from examining system.web section of the web.config file:

  <system.web>
    <machineKey compatibilityMode="Framework20SP2" validationKey="a4c44e321ad34e783fbcc8dd58d469577097e0cef52beba39a36dc11996e06d2d8603f2155975bc22fd9367c4d66f7ff80101ad5a3339fad002d0aaadf5f6bdb" decryptionKey="31ce2f55ebf54100519d55ad62e9d93ffec98ccd8c7fcea2b6f8f1ff5a7db86c" validation="HMACSHA256" decryption="AES" />
    <httpRuntime />
    <compilation debug="true" targetFramework="4.0" />
    <authentication mode="Forms">
      <forms loginUrl="~/Account/Login" timeout="2880" name="testauth" enableCrossAppRedirects="false" />
    </authentication>
  </system.web>
  <system.webServer>
    <validation validateIntegratedModeConfiguration="false" />
    <modules>
      <add name="ClaimsFormsAuthentication" type="MembershipAuth.HttpModules.ClaimsFormsAuthenticationModule" />
    </modules>
  </system.webServer>

Notice that the machineKey and forms sections are exactly the same as in the IdentityAuth application. Additionally we have authentication mode set to Forms. In order to use claims identity we need to implement a custom ClaimsFormsAuthenticationModule:

UPDATE 2014.09.16: to make the auth cookie smaller I replaced the previous serialization code with more concise one

namespace MembershipAuth.HttpModules
{
    public class ClaimsFormsAuthenticationModule : IHttpModule
    {
        public void Dispose()
        {
        }

        public void Init(HttpApplication context)
        {
            context.PostAuthenticateRequest += context_PostAuthenticateRequest;
        }

        void context_PostAuthenticateRequest(object sender, EventArgs e)
        {
            var user = HttpContext.Current.User;
            if (user != null && user.Identity.IsAuthenticated && user.Identity is FormsIdentity)
            {
                var formsIdentity = (FormsIdentity)user.Identity;
                // user is authenticated - we will transform his identity
                var claimsPrincipal = new ClaimsPrincipal(user);
                var claimsIdentity = (ClaimsIdentity)claimsPrincipal.Identity;

                var userData = formsIdentity.Ticket.UserData;
                if (!String.IsNullOrEmpty(userData))
                {
                    var reader = new JsonTextReader(new StringReader(userData));
                    while (reader.Read())
                    {
                        claimsIdentity.Claims.Add(new Claim(item.Key, item.Value.ToString()));
                        if (reader.TokenType == JsonToken.PropertyName)
                        {
                            var ctype = (String) reader.Value;
                            if (reader.Read() && reader.TokenType == JsonToken.String)
                            {
                                claimsIdentity.Claims.Add(new Claim(ctype, reader.Value.ToString()));
                            }
                        }
                    }
                }

                HttpContext.Current.User = claimsPrincipal;
                Thread.CurrentPrincipal = claimsPrincipal;
            }
        }

        public class SimpleClaim
        {
            public String ClaimType { get; set; }

            public String Value { get; set; }
        }
    }
}

As you can see, after successful forms authentication we transform the FormsIndentity into ClaimsIdentity. Additionally we deserialize user data of the forms authentication ticket into claims. I haven’t mentioned yet how I imported claims classes and structures into a .NET4.0 application. I needed to install a Windows Identity Foundation (aka Microsoft.IdentityModel) Nuget package which is a predecessor of the System.IdentityModel assembly. I also added following lines to the web.config file:

  <configSections>
    <section name="microsoft.identityModel" type="Microsoft.IdentityModel.Configuration.MicrosoftIdentityModelSection, Microsoft.IdentityModel, Version=3.5.0.0, Culture=neutral, PublicKeyToken=31bf3856ad364e35" />
  </configSections>
  <microsoft.identityModel>
    <service>
      <claimsAuthorizationManager type="MembershipAuth.Authz.AuthorizationManager" />
    </service>
  </microsoft.identityModel>

Our claims authorization manager is quite simple and it only checks if user trying to perfom LoginAsKing action is actually a king:

namespace MembershipAuth.Authz
{
    public class AuthorizationManager : ClaimsAuthorizationManager
    {
        public override bool CheckAccess(AuthorizationContext context)
        {
            var action = context.Action.FirstOrDefault();
            if (action != null && String.Equals(action.Value, "LoginAsKing", StringComparison.Ordinal)) {
                foreach (ClaimsIdentity identity in context.Principal.Identities) {
                    if (identity.Claims.Where(c => String.Equals(c.ClaimType, "urn:usertype", StringComparison.Ordinal)
                            && String.Equals(c.Value, "king", StringComparison.Ordinal)).Any()) {
                        return true;
                    }
                }
            }
            return false;
        }
    }
}

Finally it’s time to bind our AuthorizationManager with actions in the controller. For this purpose we will use the Thinktecture.IdentityModel library (available as a Nuget package for .NET4.0 and .NET4.5). It implements a ClaimsAuthorizeAttribute which you can use to apply resource/action based authorization in your application. It’s a much better choice than the framework’s default role based authorization which forces you to mix business and authorization logic (more on this subject can be found in Dominick Baier’s article: http://leastprivilege.com/2014/06/24/resourceaction-based-authorization-for-owin-and-mvc-and-web-api/). Finally it’s time to present our HomeController actions:

namespace MembershipAuth.Controllers
{
    public class HomeController : Controller
    {
        //
        // GET: /Home/

        public ActionResult Index() {
            return Content(User.Identity.IsAuthenticated ? User.Identity.Name : "Anonymous");
        }

        [Authorize]
        public ActionResult Auth() {
            return Content("auth");
        }

        [ClaimsAuthorize("LoginAsKing")]
        public ActionResult ClaimsAuth()
        {
            return Content("authz");
        }
    }
}

Only test user will be allowed to perform ClaimsAuth action as only he claims to be a king :). Both admin and test can call Auth action. As you can see our MembershipAuth application understands cookies generated by the IdentityAuth application and additionally authorizes users based on theirs claims – our goal is achieved.

I strongly encourage you to use Thinktecture.IdentityModel library to implement action/resource based authorization in all your applications. Also if you need to migrate data model from SQL Membership to ASP.NET Identity check out this tutorial. Finally, source code of the MembershipAuth and the IdentityAuth applications is available for download from my blog samples site.


Filed under: ASP.NET Security, CodeProject

Decrypting ASP.NET Identity cookies

$
0
0

I decided recently I need to learn Python. It’s a great scripting language, often used in forensics, diagnostics and debugging tools. There is even a plugin for windbg that allows you to script this debugger in Python language, but it’s a subject for another post. Moving back to learning Python – as an exercise I wrote a simple tool to decrypt ASP.NET Identity cookies and ASP.NET Anti-Forgery tokens. You may find it useful in situations when you need to diagnose why one of your users can’t sign in into your applications or is not authorize to access one of its parts. It does not perform validation but only decrypts the content using 256-bit AES (let me know in comments if you need some other decryption algorithm to be implemented). Adding validation logic shouldn’t be a big deal and the nist library (which I used for cryptographic operations) provides all the necessary functions.

The script goes as follows:

# -*- coding: utf-8 -*-
import base64
import logging
import argparse
import struct
import gzip
from StringIO import StringIO
from cryptography.hazmat.primitives.ciphers import Cipher, algorithms, modes
from cryptography.hazmat.primitives import hashes, padding, hmac
from cryptography.hazmat.backends import default_backend


def derivekey(key, label, context, keyLengthInBits):
    lblcnt = 0 if None == label else len(label)
    ctxcnt = 0 if None == context else len(context)
    buffer = ['\x00'] * (4 + lblcnt + 1 + ctxcnt + 4)
    if lblcnt != 0:
        buffer[4:(4 + lblcnt)] = label
    if ctxcnt != 0:
        buffer[(5 + lblcnt):(5 + lblcnt + ctxcnt)] = context
    _writeuint(keyLengthInBits, buffer, 5 + lblcnt + ctxcnt)
    dstoffset = 0
    v = keyLengthInBits / 8
    res = ['\x00'] * v
    num = 1
    while v > 0:
        _writeuint(num, buffer, 0)
        h = hmac.HMAC(key, hashes.SHA512(), backend=default_backend())
        h.update(''.join(buffer))
        hash = h.finalize()
        cnt = min(v, len(hash))
        res[dstoffset:cnt] = hash[0:cnt]
        dstoffset += cnt
        v -= cnt
        num += 1
    return ''.join(res)

def _writeuint(v, buf, offset):
    buf[offset:(offset + 4)] = struct.pack('>I', v)

def _tokendecode(aspnetstr):
    if len(aspnetstr) < 1:
        raise ValueError('Invalid input')

    # add padding if necessary - last character of the string defines the padding length
    num = ord(aspnetstr[-1]) - 48
    if num < 0 or num > 10:
        return None

    return base64.urlsafe_b64decode(aspnetstr[:-1] + num * '=')

def _decode(aspnetstr):
    # add padding if necessary
    pad = 3 - ((len(args.aspnetstr) + 3) % 4)
    if pad != 0:
        aspnetstr += pad * '='
    return base64.urlsafe_b64decode(aspnetstr)

def decrypt(dkey, b):
    # extract initialization vector (256 bit)
    iv = b[0:16]
    decryptor = Cipher(algorithms.AES(dkey), modes.CBC(iv), backend=default_backend()).decryptor()
    unpadder = padding.PKCS7(algorithms.AES.block_size).unpadder()

    ciphertext = b[16:-32]
    text_padded = decryptor.update(ciphertext) + decryptor.finalize()
    return unpadder.update(text_padded) + unpadder.finalize()

if __name__ == '__main__':
    # Turn on Logging
    logging.basicConfig(level=logging.DEBUG, format='%(asctime)s %(message)s')

    parser = argparse.ArgumentParser('ASP.NET encryptor/decryptor')
    parser.add_argument('aspnetstr', metavar='aspnet-text', help='ASP.NET encrypted text')
    parser.add_argument('-skey', required=True, help='Symmetric key for AES encryption/decryption')
    parser.add_argument('-enctype', required=False, help='Type of action that generated the given encryption text (owinauth or antiforgery)')
    args = parser.parse_args()

    skey = args.skey.decode('hex')
    label = None
    context = None
    compressed = False
    encrypted = None
    if args.enctype == 'owinauth':
        label = b'>Microsoft.Owin.Security.Cookies.CookieAuthenticationMiddleware\x11ApplicationCookie\x02v1'
        context = b'User.MachineKey.Protect'
        compressed = True
        encrypted = _decode(args.aspnetstr)
    elif args.enctype == 'antiforgery':
        label = b'/System.Web.Helpers.AntiXsrf.AntiForgeryToken.v1'
        context = b'User.MachineKey.Protect'
        encrypted = _tokendecode(args.aspnetstr)

    dkey = derivekey(skey, context, label, 256)
    decrypted = decrypt(dkey, encrypted)

    if compressed:
        decrypted = gzip.GzipFile(fileobj=StringIO(decrypted)).read()

    print "%s %s" % (decrypted.encode('hex'), decrypted)

It works only with keys explicitly defined in web.config in machineKey section, eg.

...
  <system.web>
    ...
    <machineKey decryption="AES" decryptionKey="22d14047d53135334cb08d4b4d7da1dcfccd0eae9e66fea0b8dfdcdca085a683" 
                validation="HMACSHA256" validationKey="c2aec26d010bb4224ab2189184cca3c1b43ae9688026ae4a2f851fbf5521c73f" />
    <httpRuntime targetFramework="4.5" />
    ...
  </system.web>
...

I also placed it in my Python scripts repository. Example calls:

PS python-crypto> python .\aspnetcrypto.py -enctype owinauth -skey BE5CF08F3D2E21DB3601E280503BF78E4EBD02D49245DCB37057DD1369A5172B sIqR0-eLDTb5LBvpH54dU4LI-qPIF4a5EirVltpf7FEPWVnKsyh6-djZWag2_fs5a7OietPNO-_DmfQKJrYSeGbbjf5Dt5CqWscqgKQSCjvBDevOEKUW4TS0Zm8VJA58rlpE877pybvFy_EifvdK8Dk_zIZYRPhNNHHHffDtBqmD2ocIv6NkY4NkvEtmbRK04c7oLQMM-92LMAQWk-SfCoRTUeWljOPNrd6eQ5XZ97uwuVi6smGJ0uXoYAv_eFNJjkNg1EL82VKu2t4AMvxGgf1T6YAdC4pJvl9zlb8ew07vVa6tSzcPrpe-KW2FhHUOHHnFUh7KOkloG-WWv_ePvKv02jusSWHFnbi3f7zK7eksbVNcoT0J_Gce9wELMa3aBM3u56cIKViVhIQAzWg6nFRTsUh8LIxHXVOnFhk7-3jndshd-QDv_KJ1C6rEyjIdgu61-2n2_jI-s3dt4fr70IG_U5dq6gGms3uXtLInEbXezTBxMW4RFGrqGafjtMc-BOSmGcCKXjskgbxtkZPyu2GiKTnOSncPMPv9bPP6dOI
02000000114170706c69636174696f6e436f6f6b6965010001000700000044687474703a2f2f736368656d61732e786d6c736f61702e6f72672f77732f323030352f30352f6964656e746974792f636c61696d732f6e616d656964656e7469666965720a3137343834303230393001000100010001000873736f6c6e69636101000100010051687474703a2f2f736368656d61732e6d6963726f736f66742e636f6d2f616363657373636f6e74726f6c736572766963652f323031302f30372f636c61696d732f6964656e7469747970726f7669646572104153502e4e4554204964656e746974790100010001001d4173704e65742e4964656e746974792e53656375726974795374616d702464333830613932392d663538302d343038392d626263392d3535623238613439326538640100010001002e687474703a2f2f6170706c69636174696f6e2f636c61696d732f617574686f72697a6174696f6e2f616374696f6e0e52573a5a616c6f67756a4a616b6f0100010001002e687474703a2f2f6170706c69636174696f6e2f636c61696d732f617574686f72697a6174696f6e2f616374696f6e0e52503a5a616c6f67756a4a616b6f0100010001001575726e3a64703a6c6f6767656475736572747970650149010001000100000000000100000002000000072e6973737565641d5765642c203239204f637420323031342031323a31303a313720474d54082e657870697265731d5765642c203132204e6f7620323031342031323a31303a313720474d54 ☻   ◄ApplicationCookie☺ ☺    Dhttp://schemas.xmlsoap.org/ws/2005/05/identity/claims/nameidentifier
1748402090☺ ☺ ☺ ssolnica☺ ☺ ☺ Qhttp://schemas.microsoft.com/accesscontrolservice/2010/07/claims/identityprovider►ASP.NET Identity☺ ☺ ☺ ↔AspNet.Identity.SecurityStamp$d380a929-f580-4089-bbc9-55b28a492e8d☺ ☺ ☺ .http://application/claims/authorization/action♫RW:ZalogujJako☺ ☺ ☺ .http://application/claims/authorization/action♫RP:ZalogujJako☺ ☺ ☺ §urn:dp:loggedusertype☺I☺ ☺ ☺     ☺   ☻   .issued↔Wed, 29 Oct 2014 12:10:17 GM.expires↔Wed, 12 Nov 2014 12:10:17 GMT

PS python-crypto> python .\aspnetcrypto.py -enctype antiforgery -skey 22d14047d53135334cb08d4b4d7da1dcfccd0eae9e66fea0b8dfdcdca085a683 22d14047d53135334cb08d4b4d7da1dcfccd0eae9e66fea0b8dfdcdca085a683 IgoPD31Z0v-eCQyBZeu_wL-Vvr8IlmIpci-9iZD6F1S5Tf_HZb0GOMLEOjWU5aGjg_UtpYZ07vB3TRsrBEsJoTa5k4U1ygm68CmuBMaQ5G01
013382f4b0bc9f19dbce20a58893b4e32801 ☺3é˘░╝č↓█╬ ąłô┤Ń(☺

While writing this script I’ve learnt few interesting facts about encryption in ASP.NET. The keys you provide in the machineKey section are not directly used in ecnryption and validation logic, but derivative keys are created taking into account a context and a label (according to the NIST specification). A context in ASP.NET applications is a string: User.MachineKey.Protect. Label is different for each part of the framework. For ASP.NET Identity cookies it’s equal to >Microsoft.Owin.Security.Cookies.CookieAuthenticationMiddleware\x11ApplicationCookie\x02v1 when for Anti-Forgery token it’s /System.Web.Helpers.AntiXsrf.AntiForgeryToken.v1. Another value would be used for forms authentication cookies. You may find some of those values in the Purpose class source code. Another interesting fact is that base64 url encoding implementation differs between parts of the ASP.NET framework. Anti-Forgery tokens are encoded with one additional char specifying the number of padding characters (‘=’) when ASP.NET Identity cookies do not contain such information (padding characters number is calculated based on cookie value length modulo 4).

If you ever need to go deeper into ASP.NET cryptography, some interesting classes to look into are: MachineKey, AspNetCryptoServiceProvider, NetFXCryptoService, Purpose and SP800_108


Filed under: ASP.NET Security

How to debug Windows Services written in .NET? (part I)

$
0
0

Diagnosing Windows Services might sometimes be cumbersome – especially when errors occur during the service start. In this two-parts series I am going to show you different ways how to handle such problems in production. In the first part we will focus on “exceptions discovery” techniques which very often are enough to figure out why our service is not working. In the second part we will setup a debugging environment and attach a debugger to our service. Let’s start then.

Logging

Collecting traces is the less invasive way of diagnostics and, if done correctly, is surprisingly effective. Loggers are one of the first things you should configure when developing a new application. Think what you should log, what would be the format of your logs (must be consistent) and which verbosity levels you would use (for instance VERBOSE for debug logs, ERROR for swallowed exceptions, CRITICAL for unhandled exceptions etc.). It is worth to write down those rules and include later in the release documentation. My logging library of choice is NLog and I’ve already published few articles how to configure it, so I won’t repeat myself but provide you with some links:

If you prefer System.Diagnostics namespace I also have something for you:)

Try to log as much as you can in a given context – as for exceptions do not always rely on Exception.ToString() method. It is worth to write a separate catch block for an exception which is known to have a meaningless string representation (such as DbUpdateException or DbEntityValidationException) and iterate through its properties in the log.

In quest for the exception log (introducing inwrap.exe)

When the service you need to diagnose does not generate any logs, situation becomes much more difficult. In such a case you may start with collecting traces using sysinternals tools. Keep in mind though that sysinternals log is scarce for .NET applications and it won’t reveal more than a name of the exception being thrown. Also, by default sysinternals tools do not provide you with a way to diagnose a faulty start of a service (I will write more about this in the second part of the series). These are the reasons why inwrap.exe was born. Inwrap is a simple application which wraps the original service and logs all the managed exceptions (including the handled ones) that occur in it. Additionally you may create your own exception handlers which will be called by InWrap, allowing you to collect application-specific information required to diagnose a given exception. To trace exceptions in a standalone application just call:

inwrap.exe your-app.exe

To trace a Windows service we need to install inwrap as a wrapper for the .exe file of the service. It may sound difficult but is just a matter of calling:

inwrap.exe -install your-service.exe

From now on, anytime you start the service it will be wrapped by inwrap.exe. To uninstall, change -install to -uninstall in the above command. Simple, isn’t it?

By default inwrap writes logs to console and Windows debug output, but you can easily change this by modifying inwrap.exe.config file and adding any TraceListener you like. Inwrap has embedded the Essential.Diagnostics library so using one of their listeners is a matter of adding few lines to the configuration file. For example if you would like to change System.Diagnostics.ConsoleTraceListener to Essential.Diagnostics.ColoredConsoleTraceListener you could use the following configuration (no additional assemblies are needed):

<?xml version="1.0" encoding="utf-8"?>
<configuration>
  <system.diagnostics>
    <trace autoflush="true"/>
    <sharedListeners>
        <add name="colored-console" type="Essential.Diagnostics.ColoredConsoleTraceListener, Essential.Diagnostics" />
    </sharedListeners>
    <sources>
      <source name="LowLevelDesign.Diagnostics.InWrap" switchValue="Verbose">
        <listeners>
          <add name="colored-console" />
        </listeners>
      </source>
    </sources>
  </system.diagnostics>
  <startup>
    <supportedRuntime version="v4.0" sku=".NETFramework,Version=v4.0"/>
  </startup>
</configuration>

Finally the most interesting part of inwrap are exception handlers. You specify a folder where handlers are stored by using the -handlers <handlers-folder-path> switch. On start inwrap scans the handlers folder for assemblies which names end with Exception or Exceptions. When it finds such an assembly it will check if it contains any static class with a method accepting System.Diagnostics.TraceSource as a first parameter and a derive from System.Exception as a second. If inwrap finds such a method, it will call it when exception of a given type occurs in the examined application. Example DbUpdateException handler might look as follows:

using Dapper;
using System.Data;
using System.Data.Entity.Infrastructure;
using System.Data.SqlClient;
using System.Diagnostics;
using System.Linq;

namespace Trader.Domiporta.Zolas
{
  public static class DbUpdateExceptionHandler
  {
    public static void HandleException(TraceSource logger, DbUpdateException ex)
    {
      foreach (DbEntityEntry dbEntityEntry in ex.Entries)
      {
        FlapiAdvert flapiAdvert = dbEntityEntry.Entity as FlapiAdvert;
        if (flapiAdvert != null)
        {
          using (SqlConnection sqlConnection = new SqlConnection("data source=....."))
          {
            sqlConnection.Open();
            if (Enumerable.FirstOrDefault<ApplicationUser>(SqlMapper.Query<ApplicationUser>((IDbConnection) sqlConnection, "select * from users where id = @UserId", (object) flapiAdvert, (IDbTransaction) null, true, new int?(), new CommandType?())) == null)
              logger.TraceEvent(TraceEventType.Error, 0, "User {0} could not be found for advert {1}", (object) flapiAdvert.UserId, (object) flapiAdvert.AlladsId);
          }
        }
      }
    }
  }
}

It is a sample from my work diagnostics case – we had a problem in production in our synchronization service. I could see that it was throwing DbUpdateExceptions but didn’t know exactly why. As I didn’t want to modify and deploy the whole service I simply run it under inwrap and from the log figured out which entities in our database were problematic.

Does it work with Topshelf services?

Unfortunately not from the box. Topshelf is very strict about what’s passed to the service on the command line and throws exception on unregistered parameters and switches. It also does not allow running a service under the remote debugger (more about this in the second part of the series). To overcome those issues I prepared a small Nuget package: Topshelf.Diagnostics which contains all the necessary classes to make Topshelf services debuggable. For inwrap to work with your service you just need to add call to the ApplyCommandLineWithInwrapSupport in your host configuration section, example:

class Program
{
    private static readonly Logger logger = LogManager.GetCurrentClassLogger();

    private static void Main() {
        HostFactory.Run(hc => {
            hc.UseNLog();
            // service is constructed using its default constructor
            hc.Service<SampleService>();
            // sets service properties
            hc.SetServiceName(typeof(SampleService).Namespace);
            hc.SetDisplayName(typeof(SampleService).Namespace);
            hc.SetDescription("Sample service.");

            hc.ApplyCommandLineWithInwrapSupport();
        });
    }
}

Note, that if inwrap is not present this method behaves in the same way as Topshelf’s default ApplyCommandLine so all the command line switches should work just fine. In case you run in any problems just let me know. Inwrap can be downloaded from the diagnettoolkit github repository.


Filed under: Diagnosing exceptions in .NET

Debug Recipes

$
0
0

This one would be short :) While learning new things I write notes, collect help files and sample code. I use my Google Drive to store them. I have decided recently that some of the folders may be worth publishing and this is how Debug Recipes repository was born. I have a plan to store in it:

I’m still working on a better navigation (each section will have a README.md file), but for now the Github search and folder navigation are the only options. As you can imagine it will always be a work in progress, but I hope that some recipes will prove useful to you. As always comments and suggestions are welcome.


Filed under: Uncategorized

Timeouts when making web requests in .NET

$
0
0

In one of our applications I recently observed timeouts in code performing HTTP requests to the REST service. While investigating this issue I discovered few interesting facts about System.Net namespace and would like to share them with you. We were using objects of type System.Net.HttpWebRequest in our code, but some of the information presented in this post will also apply to the newer System.Net.HttpClient implementation.

Exception analysis

Firstly, we will reproduce the issue with a sample application measuring WG.NET (Warsaw .NET group website) response time:

using System;
using System.Diagnostics;
using System.Net;

public class Program
{
    public static void Main(String[] args) {
        var sw = new Stopwatch();
        var logger = new TraceSource("LowLevelDesign");
        while (true) {
            logger.TraceEvent(TraceEventType.Information, 0, "HTTP request to wg.net.pl");

            sw.Restart();

            try {
                var request = WebRequest.Create("http://www.wg.net.pl");
                request.GetResponse();
            } catch (Exception ex) {
                logger.TraceEvent(TraceEventType.Information, 0, "Exception: {0}", ex);
            }

            logger.TraceEvent(TraceEventType.Information, 0, "The request took: {0} ms", sw.ElapsedMilliseconds);
        }
    }
}

Compile and run it:

LowLevelDesign Information: 0 : HTTP request to wg.net.pl
    DateTime=2015-03-07T11:50:11.5547493Z
LowLevelDesign Information: 0 : The request took: 746 ms
    DateTime=2015-03-07T11:50:12.3026958Z
LowLevelDesign Information: 0 : HTTP request to wg.net.pl
    DateTime=2015-03-07T11:50:12.3116971Z
LowLevelDesign Information: 0 : The request took: 573 ms
    DateTime=2015-03-07T11:50:12.8889227Z
LowLevelDesign Information: 0 : HTTP request to wg.net.pl
    DateTime=2015-03-07T11:50:12.8949109Z
LowLevelDesign Information: 0 : Exception: System.Net.WebException: The operation has timed out
   at System.Net.HttpWebRequest.GetResponse()
   at Program.Main(String[] args) in c:\Users\admin\code\TestRequest.cs:line 17
    DateTime=2015-03-07T11:51:52.9159422Z
LowLevelDesign Information: 0 : The request took: 100019 ms

Did you notice an exception in the output? Now, look back at the source code and guess what is wrong. Don’t worry if you don’t know – few days ago I didn’t know either :) So I turned on additional log sources from System.Net classes in the application configuration file (you can find more information about them in my Network tracing in .NET debug recipe):

<?xml version="1.0" ?>
<configuration>
    <system.diagnostics>
        <trace autoflush="true">
        </trace>
        <sharedListeners>
            <add name="console" type="System.Diagnostics.ConsoleTraceListener" traceOutputOptions="DateTime" />
            <add name="file" type="System.Diagnostics.TextWriterTraceListener" initializeData="d:\logs\testrequest.log"
                traceOutputOptions="DateTime, Callstack" />
        </sharedListeners>
        <sources>
            <source name="LowLevelDesign" switchValue="Verbose">
                <listeners>
                    <add name="file" />
                    <add name="console" />
                </listeners>
            </source>
            <source name="System.Net.Http" switchValue="Verbose">
                <listeners>
                    <add name="file" />
                </listeners>
            </source>
            <source name="System.Net.HttpListener" switchValue="Verbose">
                <listeners>
                    <add name="file" />
                </listeners>
            </source>
            <source name="System.Net" switchValue="Verbose">
                <listeners>
                    <add name="file" />
                </listeners>
            </source>
            <source name="System.Net.Sockets" switchValue="Verbose">
                <listeners>
                    <add name="file" />
                </listeners>
            </source>
        </sources>
    </system.diagnostics>
</configuration>

The generated log will contain detailed information about System.Net classes internal work. We need to find a reason why the timeout exception happened. If we look into the log file the normal request consists of the following operations (call stacks and datetimes are stripped):

LowLevelDesign Information: 0 : HTTP request to wg.net.pl
System.Net Verbose: 0 : [2764] WebRequest::Create(http://www.wg.net.pl/)
System.Net Verbose: 0 : [2764] HttpWebRequest#60068066::HttpWebRequest(http://www.wg.net.pl/#1977127123)
System.Net Information: 0 : [2764] Current OS installation type is 'Client'.
System.Net Information: 0 : [2764] RAS supported: True
System.Net Verbose: 0 : [2764] Exiting HttpWebRequest#60068066::HttpWebRequest()
System.Net Verbose: 0 : [2764] Exiting WebRequest::Create() 	-> HttpWebRequest#60068066
System.Net Verbose: 0 : [2764] HttpWebRequest#60068066::GetResponse()
System.Net Error: 0 : [2764] Can't retrieve proxy settings for Uri 'http://www.wg.net.pl/'. Error code: 12180.
System.Net Verbose: 0 : [2764] ServicePoint#34640832::ServicePoint(www.wg.net.pl:80)
System.Net Information: 0 : [2764] Associating HttpWebRequest#60068066 with ServicePoint#34640832
System.Net Information: 0 : [2764] Associating Connection#43332040 with HttpWebRequest#60068066
System.Net.Sockets Verbose: 0 : [2764] Socket#54444047::Socket(AddressFamily#2)
System.Net.Sockets Verbose: 0 : [2764] Exiting Socket#54444047::Socket()
System.Net.Sockets Verbose: 0 : [2764] Socket#20234383::Socket(AddressFamily#23)
System.Net.Sockets Verbose: 0 : [2764] Exiting Socket#20234383::Socket()
System.Net.Sockets Verbose: 0 : [2764] DNS::TryInternalResolve(www.wg.net.pl)
System.Net.Sockets Verbose: 0 : [2764] Socket#54444047::Connect(64.233.162.121:80#2040719632)
System.Net.Sockets Information: 0 : [2764] Socket#54444047 - Created connection from 192.168.1.14:59576 to 64.233.162.121:80.
System.Net.Sockets Verbose: 0 : [2764] Exiting Socket#54444047::Connect()
System.Net.Sockets Verbose: 0 : [2764] Socket#20234383::Close()
System.Net.Sockets Verbose: 0 : [2764] Socket#20234383::Dispose()
System.Net.Sockets Verbose: 0 : [2764] Exiting Socket#20234383::Close()
System.Net Information: 0 : [2764] Connection#43332040 - Created connection from 192.168.1.14:59576 to 64.233.162.121:80.
System.Net Information: 0 : [2764] Associating HttpWebRequest#60068066 with ConnectStream#47891719
System.Net Information: 0 : [2764] HttpWebRequest#60068066 - Request: GET / HTTP/1.1

System.Net Information: 0 : [2764] ConnectStream#47891719 - Sending headers
{
Host: www.wg.net.pl
Connection: Keep-Alive
}.
System.Net.Sockets Verbose: 0 : [2764] Socket#54444047::Send()
System.Net.Sockets Verbose: 0 : [2764] Data from Socket#54444047::Send
System.Net.Sockets Verbose: 0 : [2764] 00000000 : 47 45 54 20 2F 20 48 54-54 50 2F 31 2E 31 0D 0A : GET / HTTP/1.1..
System.Net.Sockets Verbose: 0 : [2764] 00000010 : 48 6F 73 74 3A 20 77 77-77 2E 77 67 2E 6E 65 74 : Host: www.wg.net
System.Net.Sockets Verbose: 0 : [2764] 00000020 : 2E 70 6C 0D 0A 43 6F 6E-6E 65 63 74 69 6F 6E 3A : .pl..Connection:
System.Net.Sockets Verbose: 0 : [2764] 00000030 : 20 4B 65 65 70 2D 41 6C-69 76 65 0D 0A 0D 0A    :  Keep-Alive....
System.Net.Sockets Verbose: 0 : [2764] Exiting Socket#54444047::Send() 	-> Int32#63
System.Net.Sockets Verbose: 0 : [2764] Socket#54444047::Receive()
System.Net.Sockets Verbose: 0 : [2764] Data from Socket#54444047::Receive
System.Net.Sockets Verbose: 0 : [2764] (printing 1024 out of 4096)
System.Net.Sockets Verbose: 0 : [2764] 00000000 : 48 54 54 50 2F 31 2E 31-20 32 30 30 20 4F 4B 0D : HTTP/1.1 200 OK.
...
System.Net.Sockets Verbose: 0 : [2764] 000003F0 : 5B 76 6F 69 64 20 30 21-3D 63 3F 63 3A 28 6E 65 : [void 0!=c?c:(ne
System.Net.Sockets Verbose: 0 : [2764] Exiting Socket#54444047::Receive() 	-> Int32#4096
System.Net Information: 0 : [2764] Connection#43332040 - Received status line: Version=1.1, StatusCode=200, StatusDescription=OK.
System.Net Information: 0 : [2764] Connection#43332040 - Received headers
{
X-Frame-Options: SAMEORIGIN
X-Robots-Tag: noarchive
X-Content-Type-Options: nosniff
X-XSS-Protection: 1; mode=block
Alternate-Protocol: 80:quic,p=0.08,80:quic,p=0.08
Vary: Accept-Encoding
Transfer-Encoding: chunked
Accept-Ranges: none
Cache-Control: public, max-age=5
Content-Type: text/html; charset=utf-8
Date: Sat, 07 Mar 2015 11:50:12 GMT
Expires: Sat, 07 Mar 2015 11:50:17 GMT
Last-Modified: Fri, 06 Mar 2015 12:02:01 GMT
Server: GSE
}.
System.Net Information: 0 : [2764] ConnectStream#28372289::ConnectStream(Buffered -1 bytes.)
System.Net Information: 0 : [2764] Associating HttpWebRequest#60068066 with ConnectStream#28372289
System.Net Information: 0 : [2764] Associating HttpWebRequest#60068066 with HttpWebResponse#54024015
System.Net Verbose: 0 : [2764] Exiting HttpWebRequest#60068066::GetResponse() 	-> HttpWebResponse#54024015
LowLevelDesign Information: 0 : The request took: 746 ms

and the timed out request:

LowLevelDesign Information: 0 : HTTP request to wg.net.pl
System.Net Verbose: 0 : [2764] WebRequest::Create(http://www.wg.net.pl/)
System.Net Verbose: 0 : [2764] HttpWebRequest#26753075::HttpWebRequest(http://www.wg.net.pl/#1977127123)
System.Net Verbose: 0 : [2764] Exiting HttpWebRequest#26753075::HttpWebRequest()
System.Net Verbose: 0 : [2764] Exiting WebRequest::Create() 	-> HttpWebRequest#26753075
System.Net Verbose: 0 : [2764] HttpWebRequest#26753075::GetResponse()
System.Net Information: 0 : [2764] Associating HttpWebRequest#26753075 with ServicePoint#34640832
System.Net Information: 0 : [2764] Associating Connection#43332040 with HttpWebRequest#26753075
System.Net Verbose: 0 : [6776] HttpWebRequest#26753075::Abort(The operation has timed out)
System.Net Error: 0 : [6776] Exception in HttpWebRequest#26753075:: - The operation has timed out.
System.Net Verbose: 0 : [6776] Exiting HttpWebRequest#26753075::Abort()
System.Net Error: 0 : [2764] Exception in HttpWebRequest#26753075::GetResponse - The operation has timed out.
LowLevelDesign Information: 0 : Exception: System.Net.WebException: The operation has timed out
   at System.Net.HttpWebRequest.GetResponse()
   at Program.Main(String[] args) in c:\Users\Sebastian\Dysk Google\lab\webrequest-timeout\code\TestRequest.cs:line 17
LowLevelDesign Information: 0 : The request took: 100019 ms

If we turn on call stacks in the trace log (traceOutputOptions) we would see that the last operation before the exception occurred was System.Net.Connection.SubmitRequest:

System.Net Information: 0 : [5616] Associating Connection#13869071 with HttpWebRequest#58328727
    DateTime=2015-03-07T11:30:12.0283827Z
    Callstack=   at System.Environment.GetStackTrace(Exception e, Boolean needFileInfo)
   at System.Environment.get_StackTrace()
   at System.Diagnostics.TraceEventCache.get_Callstack()
   at System.Diagnostics.TraceListener.WriteFooter(TraceEventCache eventCache)
   at System.Diagnostics.TraceListener.TraceEvent(TraceEventCache eventCache, String source, TraceEventType eventType, Int32 id, String message)
   at System.Diagnostics.TraceSource.TraceEvent(TraceEventType eventType, Int32 id, String message)
   at System.Net.Logging.PrintLine(TraceSource traceSource, TraceEventType eventType, Int32 id, String msg)
   at System.Net.Logging.Associate(TraceSource traceSource, Object objA, Object objB)
   at System.Net.Connection.SubmitRequest(HttpWebRequest request, Boolean forcedsubmit)
   at System.Net.ServicePoint.SubmitRequest(HttpWebRequest request, String connName)
   at System.Net.HttpWebRequest.SubmitRequest(ServicePoint servicePoint)
   at System.Net.HttpWebRequest.GetResponse()

Checking .NET source code we could see that the possible place where this method might hang is:

if (!request.Async)
{
    object responseObject = request.ConnectionAsyncResult.InternalWaitForCompletion();
    ConnectStream writeStream = responseObject as ConnectStream;
    ...

There comes a moment when we need to take a step back and understand how System.Net requests are performed.

System.Net nuances and configuration settings

Each time you create a request, there is a System.Net.ServicePoint assigned to it. ServicePoint then tries to find a connection which will serve a given request. Each write and read operation on a connection is performed by a ConnectStream instance. Connections are pooled and their number is by default limited to two connections per IP address. You may configure the maximum number of connections per IP address or DNS name in the application configuration file (section system.net\connectionManagement\add), eg.:

<configuration>
  <system.net>
    <connectionManagement>
      <add address = "http://www.wg.net.pl" maxconnection = "4" />
      <add address = "*" maxconnection = "2" />
    </connectionManagement>
  </system.net>
</configuration>

This explains why we received a timeout after two successful requests. We might now suspect that our first requests are blocking subsequent ones, but why? Let’s collect a memory dump while the application is waiting for a request to finish (you may find information how to collect a memory dump in this recipe).

Analysing a memory dump

We open the dump in WinDbg. Then we load the SOS extension with a command: .loadby sos clr and display the current thread’s stack with !CLRStack -a:

OS Thread Id: 0xa18 (0)
Child SP       IP Call Site
00eaec60 7709cc2c [HelperMethodFrame_1OBJ: 00eaec60] System.Threading.WaitHandle.WaitOneNative(System.Runtime.InteropServices.SafeHandle, UInt32, Boolean, Boolean)
00eaed44 728b64f0 System.Threading.WaitHandle.InternalWaitOne(System.Runtime.InteropServices.SafeHandle, Int64, Boolean, Boolean)
    PARAMETERS:
        waitableSafeHandle = <no data>
        millisecondsTimeout = <no data>
        hasThreadAffinity = <no data>
        exitContext = <no data>
    LOCALS:
        <no data>

00eaed5c 728b64c4 System.Threading.WaitHandle.WaitOne(Int32, Boolean)
    PARAMETERS:
        this = <no data>
        millisecondsTimeout = <no data>
        exitContext = <no data>

00eaed70 71cea6b1 System.Net.LazyAsyncResult.WaitForCompletion(Boolean)
    PARAMETERS:
        this (0x00eaed70) = 0x02d9ca5c
        snap = <no data>
    LOCALS:
        <no data>
        0x00eaed74 = 0x00000001
        <no data>
        <no data>

00eaeda0 71cfe3cf System.Net.Connection.SubmitRequest(System.Net.HttpWebRequest, Boolean)
    PARAMETERS:
        this (0x00eaeda8) = 0x02c9c204
        request (0x00eaeda4) = 0x02d84a28
        forcedsubmit = <no data>
    LOCALS:
        0x00eaedbc = 0xffffffff
        0x00eaedb8 = 0x00000000
        <no data>
        <no data>
        <no data>
        <no data>
        0x00eaedb0 = 0x00000001
        <no data>
        <no data>

00eaede8 71cfcf3b System.Net.ServicePoint.SubmitRequest(System.Net.HttpWebRequest, System.String)
    PARAMETERS:
        this = <no data>
...

Let’s then find which objects reference the connection assigned to our request (0x02c9c204):

0:000> !GCRoot -all 0x02c9c204
Thread a18:
    00eaed70 71cea6b1 System.Net.LazyAsyncResult.WaitForCompletion(Boolean)
        ebp+28: 00eaed70
            ->  02d9ca5c System.Net.LazyAsyncResult
            ->  02d84a28 System.Net.HttpWebRequest
            ->  02c9b0e4 System.Net.ServicePoint
            ->  02c9b1ac System.Collections.Hashtable
            ->  02c9b1e0 System.Collections.Hashtable+bucket[]
            ->  02c9c110 System.Net.ConnectionGroup
            ->  02c9c1b0 System.Collections.ArrayList
            ->  02c9c1c8 System.Object[]
            ->  02c9c204 System.Net.Connection

    00eaeda0 71cfe3cf System.Net.Connection.SubmitRequest(System.Net.HttpWebRequest, Boolean)
        ebp+34: 00eaeda8
            ->  02c9c204 System.Net.Connection

    ...

    00eaee90 010b0126 Program.Main(System.String[]) [c:\Users\Sebastian\Dysk Google\lab\webrequest-timeout\TestRequest.cs @ 17]
        ebp+64: 00eaeeb4
            ->  02d69fbc System.Net.HttpWebResponse
            ->  02d5fe2c System.Net.ConnectStream
            ->  02cadf4c System.Net.Connection
            ->  02c9c110 System.Net.ConnectionGroup
            ->  02c9c1b0 System.Collections.ArrayList
            ->  02c9c1c8 System.Object[]
            ->  02c9c204 System.Net.Connection

    ...

Found 13 roots.

References coming from the ServicePoint are expected as we have a request waiting on this connection. What we do not expect is a reference from a ConnectStream coming from some HttpWebResponse instance. Let’s dump the ConnectStream instance:

0:000> !do 02d5fe2c
Name:        System.Net.ConnectStream
MethodTable: 71d76afc
EEClass:     71bb164c
Size:        116(0x74) bytes
File:        C:\Windows\Microsoft.Net\assembly\GAC_MSIL\System\v4.0_4.0.0.0__b77a5c561934e089\System.dll
Fields:
      MT    Field   Offset                 Type VT     Attr    Value Name
...
71d75b24  4001d1c       24 ...em.Net.Connection  0 instance 02cadf4c m_Connection
729c6d34  4001d1d       28        System.Byte[]  0 instance 00000000 m_ReadBuffer
729c560c  4001d1e       4c         System.Int32  1 instance        0 m_ReadOffset
729c560c  4001d1f       50         System.Int32  1 instance        0 m_ReadBufferSize
729d05f4  4001d20       18         System.Int64  1 instance -1 m_ReadBytes
729cf91c  4001d21       6a       System.Boolean  1 instance        1 m_Chunked
729c560c  4001d22       54         System.Int32  1 instance        0 m_DoneCalled
729c560c  4001d23       58         System.Int32  1 instance        0 m_ShutDown
729c3f60  4001d24       2c     System.Exception  0 instance 00000000 m_ErrorException
...

Notice that the m_Connection instance has the same address as our request connection. Additionally this ConnectStream is not closed (m_DoneCalled == 0, m_ShutDown == 0). We can check in the .NET source code that the m_DoneCalled property is being set in the CallDone method of the ConnectStream class. This method also dequeues the next request waiting on the connection owned by this ConnectStream instance – in our case it would be our hanging request. Now the timeout cause is clear – we forgot to close (or dispose) the response and thus its underlying ConnectStream.

I created two WinDbg commands to make further investigations faster. The first command to find undisposed ConnectStreams (we are checking if the m_DoneCalled (offset 0x54) property is not set):

.foreach (addr {!DumpHeap -type System.Net.ConnectStream -short}) { .if (not dwo( addr + 54)) { !do addr; }}

and the second command to find connections with waiting requests (we are checking if size (offset 0xc) of the m_WaitList (offset 0x5c) is greater than zero):

0:000> !Name2EE System.dll!System.Net.Connection
Module:      71b51000
Assembly:    System.dll
Token:       020004e9
MethodTable: 71d75b24
EEClass:     71b737c4
Name:        System.Net.Connection
0:000> .foreach (addr {!DumpHeap -mt 71d75b24 -short}) { .if (dwo(poi( addr + 5c ) + c)) { !do addr } }

I’m using the new HttpClient – am I safe?

Yes, you are. HttpClient is a wrapper over HttpWebRequest and HttpWebResponse and releases properly all the network resources. But system.net constraints and configuration still applies to you – so remember about the connections limit or expect100Continue parameter. If you don’t know it check what it is, because you probably would like to have it disabled :)


Filed under: CodeProject, Diagnosing network issues in .NET

A case of a deadlock in a .NET application

$
0
0

I recently had an interesting issue in one of our applications. The SMS router, responsible for sending and receiving SMSes, hanged – there was no CPU usage and we haven’t observed any activity in the application logs. I collected a full memory dump and restarted the service, which seemed to come back to its normal state. Curious what happened I opened the dump in WinDbg, loaded PDE and SOS and started an investigation

When analysing hanging application I usually start by listing all process threads with their call stacks: ~*e!CLRStack. If you can’t see any Monitor.Wait’s on the stacks you probably need to examine native stacks (with !DumpStack or k commands). In our case stacks seem to indicate a hang in managed code:

...
OS Thread Id: 0xdb4 (5)
Child SP       IP Call Site
04f9ed60 778aca2c [GCFrame: 04f9ed60]
04f9ef00 778aca2c [GCFrame: 04f9ef00]
04f9eeb0 778aca2c [HelperMethodFrame: 04f9eeb0] System.Threading.Monitor.ReliableEnter(System.Object, Boolean ByRef)
04f9ef40 73a2d887 System.Threading.Monitor.Enter(System.Object, Boolean ByRef)
04f9ef50 73483b89 System.Diagnostics.TraceSource.TraceEvent(System.Diagnostics.TraceEventType, Int32, System.String)
...
OS Thread Id: 0x1220 (6)
Child SP       IP Call Site
050ded18 778aca2c [GCFrame: 050ded18]
050deebc 778aca2c [GCFrame: 050deebc]
050dee6c 778aca2c [HelperMethodFrame: 050dee6c] System.Threading.Monitor.ReliableEnter(System.Object, Boolean ByRef)
050deefc 72e3b9fa System.Diagnostics.DiagnosticsConfiguration.Initialize()
050def2c 72e3c06c System.Diagnostics.DiagnosticsConfiguration.get_SwitchSettings()
050def34 72e3c01a System.Diagnostics.Switch.InitializeConfigSettings()
050def40 72e3be34 System.Diagnostics.Switch.InitializeWithStatus()
050def84 72e3bd99 System.Diagnostics.Switch.get_SwitchSetting()
050def90 72e38594 System.Diagnostics.SourceSwitch.ShouldTrace(System.Diagnostics.TraceEventType)
050def98 72e43e64 System.Diagnostics.TraceSource.TraceEvent(System.Diagnostics.TraceEventType, Int32, System.String, System.Object[])
050deff0 049cf16f MySql.Data.MySqlClient.MySqlTrace.LogWarning(Int32, System.String)
050df008 049ce938 MySql.Data.MySqlClient.MySqlConnection.HandleTimeoutOrThreadAbort(System.Exception)
050df100 03a8d7c7 MySql.Data.MySqlClient.MySqlCommand.ExecuteReader(System.Data.CommandBehavior)
050df218 0479219f MySql.Data.MySqlClient.MySqlCommand.ExecuteNonQuery()
050df248 0556a7cf Dapper.SqlMapper.ExecuteCommand(System.Data.IDbConnection, Dapper.CommandDefinition ByRef, System.Action`2)
050df280 0556777e Dapper.SqlMapper.ExecuteImpl(System.Data.IDbConnection, Dapper.CommandDefinition ByRef)
050df2e4 05567460 Dapper.SqlMapper.Execute(System.Data.IDbConnection, System.String, System.Object, System.Data.IDbTransaction, System.Nullable`1, System.Nullable`1)
...
OS Thread Id: 0xdf0 (7)
Child SP       IP Call Site
0521ea44 778aca2c [GCFrame: 0521ea44]
0521eb1c 778aca2c [GCFrame: 0521eb1c]
0521eb38 778aca2c [HelperMethodFrame_1OBJ: 0521eb38] System.Threading.Monitor.ReliableEnter(System.Object, Boolean ByRef)
0521ebb4 72e3bdf9 System.Diagnostics.Switch.InitializeWithStatus()
0521ebf8 72e3bd99 System.Diagnostics.Switch.get_SwitchSetting()
0521ec04 72e38594 System.Diagnostics.SourceSwitch.ShouldTrace(System.Diagnostics.TraceEventType)
0521ec0c 72e43e64 System.Diagnostics.TraceSource.TraceEvent(System.Diagnostics.TraceEventType, Int32, System.String, System.Object[])
0521ec64 049cf16f MySql.Data.MySqlClient.MySqlTrace.LogWarning(Int32, System.String)
0521ec7c 049ce938 MySql.Data.MySqlClient.MySqlConnection.HandleTimeoutOrThreadAbort(System.Exception)
0521ed74 03a8d7c7 MySql.Data.MySqlClient.MySqlCommand.ExecuteReader(System.Data.CommandBehavior)
0521ee8c 0479219f MySql.Data.MySqlClient.MySqlCommand.ExecuteNonQuery()
0521eebc 03a842dd NLog.Targets.DatabaseTarget.WriteEventToDatabase(NLog.LogEventInfo)
0521eef0 03a83fd8 NLog.Targets.DatabaseTarget.Write(NLog.LogEventInfo)
0521ef1c 03a83def NLog.Targets.Target.Write(NLog.Common.AsyncLogEventInfo)
0521ef44 03a83cb6 NLog.Targets.Target.WriteAsyncLogEvent(NLog.Common.AsyncLogEventInfo)
0521ef7c 03a83ad1 NLog.LoggerImpl.WriteToTargetWithFilterChain(NLog.Internal.TargetWithFilterChain, NLog.LogEventInfo, NLog.Common.AsyncContinuation)
0521ef94 03a839f6 NLog.LoggerImpl.Write(System.Type, NLog.Internal.TargetWithFilterChain, NLog.LogEventInfo, NLog.LogFactory)
0521efbc 04607c2f NLog.Logger.WriteToTargets(NLog.LogEventInfo)
0521efd0 04601801 NLog.Logger.Log(NLog.LogEventInfo)
0521efe0 046015d1 NLog.NLogTraceListener.ProcessLogEventInfo(NLog.LogLevel, System.String, System.String, System.Object[], System.Nullable`1, System.Nullable`1, System.Nullable`1)
0521f044 04600efc NLog.NLogTraceListener.TraceEvent(System.Diagnostics.TraceEventCache, System.String, System.Diagnostics.TraceEventType, Int32, System.String, System.Object[])
0521f08c 73483d61 System.Diagnostics.TraceSource.TraceEvent(System.Diagnostics.TraceEventType, Int32, System.String, System.Object[])
...
OS Thread Id: 0xb08 (8)
Child SP       IP Call Site
0538efd4 778aca2c [GCFrame: 0538efd4]
0538f084 778aca2c [HelperMethodFrame_1OBJ: 0538f084] System.Threading.Monitor.ObjWait(Boolean, Int32, System.Object)
0538f108 73aa5d16 System.Threading.Monitor.Wait(System.Object, Int32, Boolean)
0538f118 04de1d85 Quartz.Simpl.SimpleThreadPool+WorkerThread.Run()
0538f158 73a1ab43 System.Threading.ThreadHelper.ThreadStart_Context(System.Object)
...

In your dumps you may see even bigger number of waiting threads and for most applications it would be normal. So before we jump to any conclusions we need to perform two more steps: analyze locks acquired by those waiting threads and find locks which interfere and cause a deadlock.

Finding locks

To list all Monitor locks in our application we can use the !SyncBlk command from the SOS extension:

0:000> !syncblk
Index         SyncBlock MonitorHeld Recursion Owning Thread Info          SyncBlock Owner
  306 0101284c            3         1 04cfe690 df0   7   017489b8 System.Object
  326 01012540            3         1 04cfe158 1220   6   0187258c System.Object
  329 010123a0            5         1 04cfe690 df0   7   0176d584 System.Object
  339 04cf3784            1         1 04cfdc20 db4   5   017b1bec System.Object
  340 04cf37b8            1         1 04cfe690 df0   7   017b1e44 System.Object
  342 04cf3820            1         1 04cfe158 1220   6   017b1d38 System.Object
-----------------------------
Total           344
CCW             0
RCW             1
ComClassFactory 0
Free            320

Let’s then match the result of the above command with objects referenced on the threads stacks (using the !dso command). We will start with threads 6 and 7 as they seem to be most active in locking:

blocked-stacks

I marked with colors objects the threads are waiting on and it becomes obvious that what we have here is a classic deadlock. Though we still haven’t answered a question: what operations led to this situation?

Timeline analysis

We found out that the 7th thread is waiting on a lock taken on the object at address 0x0187258c (the top-most on its stack). We also know that at some time in the past the thread 6 has successfully acquired this lock and is still holding it. We will probably gain better understanding by checking the C# code responsible for those waits. For the 7th thread it’s straightforward – after decompiling System.Diagnostics.Switch.InitializeWithStatus, i.e. the method pointed by the top-most stack frame after System.Threading.Monitor.ReliableEnter we get:

namespace System.Diagnostics {
    ...
    public abstract class Switch {
        ...
        private object m_intializedLock;
        ...
        private object IntializedLock {
            [SuppressMessage("Microsoft.Concurrency", "CA8001", Justification = "Reviewed for thread-safety")]
            get {
                if (m_intializedLock == null) {
                    Object o = new Object();
                    Interlocked.CompareExchange<Object>(ref m_intializedLock, o, null);
                }

                return m_intializedLock;
            }
        }
        ...
        private bool InitializeWithStatus() {
            if (!initialized) {

                lock (IntializedLock) {

                    if (initialized || initializing) {
                        return false;
                    }
                    ....

So we are waiting here on a private SourceSwitch lock. We know the SourceSwitch address (from the !dso command output) so we may dump it:

0:007> !DumpObj /d 01778978
Name:        System.Diagnostics.SourceSwitch
MethodTable: 72ebe134
EEClass:     72c9d164
Size:        44(0x2c) bytes
File:        C:\Windows\Microsoft.Net\assembly\GAC_MSIL\System\v4.0_4.0.0.0__b77a5c561934e089\System.dll
Fields:
      MT    Field   Offset                 Type VT     Attr    Value Name
72ebf520  4000547        4 ...lementsCollection  0 instance 00000000 switchSettings
73b23e18  4000548        8        System.String  0 instance 01721228 description
73b23e18  4000549        c        System.String  0 instance 017788ec displayName
...
73b241b8  4000550       1c        System.Object  0 instance 0187258c m_intializedLock
...

0:007> !DumpObj /d 017788ec
Name:        System.String
MethodTable: 73b23e18
EEClass:     737238f0
Size:        24(0x18) bytes
File:        C:\Windows\Microsoft.Net\assembly\GAC_32\mscorlib\v4.0_4.0.0.0__b77a5c561934e089\mscorlib.dll
String:      mysql
...

It becomes clear that the 7th thread is trying to log something related to mysql. By checking its call stack we may guess that the MySql driver attempted to log a warning about a timeout exception which had occurred in the connection. We need to discover when the 6th thread obtained the given lock. We know that the locked object is referenced on the 6th thread stack at address 0x050DEF4C which matches a call to the System.Diagnostics.Switch.InitializeWithStatus() function (child SP at 0x050def40):

050def34 72e3c01a System.Diagnostics.Switch.InitializeConfigSettings()
050def40 72e3be34 System.Diagnostics.Switch.InitializeWithStatus()
050def84 72e3bd99 System.Diagnostics.Switch.get_SwitchSetting()

By checking the SourceSwitch instance address we may be sure that it’s the same instance that blocked the 7th thread. Additionally it’s even the same situation – the MySql driver tries to log a connection timeout.

It’s time to perform a similar investigation for an object on which the 6th thread is waiting. The top-most method on the 6th thread stack, just after System.Threading.Monitor.ReliableEnter, is System.Diagnostics.DiagnosticsConfiguration.Initialize with an easy-to-spot lock statement:

namespace System.Diagnostics {
    ...
    internal static class DiagnosticsConfiguration {
        ...
        internal static void Initialize() {
            // Initialize() is also called by other components outside of Trace (such as PerformanceCounter)
            // as a result using one lock for this critical section and another for Trace API critical sections
            // (such as Trace.WriteLine) could potentially lead to deadlock between 2 threads that are
            // executing these critical sections (and consequently obtaining the 2 locks) in the reverse order.
            // Using the same lock for DiagnosticsConfiguration as well as TraceInternal avoids this issue.
            // Sequential locks on TraceInternal.critSec by the same thread is a non issue for this critical section.
            lock (TraceInternal.critSec) {
                ...
            }
        }
        ...
    }
    ...
}

We can see that the 6th thread is waiting on a global lock which is used in initializing tracing in the System.Diagnostics classes. On the 7th thread stack the object is referenced at address 0x0521F090 which points us to the System.Diagnostics.TraceSource.TraceEvent method:

0521f044 04600efc NLog.NLogTraceListener.TraceEvent(System.Diagnostics.TraceEventCache, System.String, ...
0521f08c 73483d61 System.Diagnostics.TraceSource.TraceEvent(System.Diagnostics.TraceEventType, Int32 ...
0521f0e4 04604e45 ...SmsRouter.SmsProcessing.SmsReceiveJob.CollectSmsMessagesFromProvider(...

After decompiling we can easily find the lock statement:

public void TraceEvent(TraceEventType eventType, int id, string format, params object[] args)
{
  this.Initialize();
  TraceEventCache eventCache = new TraceEventCache();
  if (!this.internalSwitch.ShouldTrace(eventType) || this.listeners == null)
    return;
  if (TraceInternal.UseGlobalLock)
  {
    lock (TraceInternal.critSec)
    ...

To summarize, the hypothetical scenario that led to the failure could be as follows:

  1. Code running on the 7th thread tried to save a log using the TraceSource.TraceEvent method and acquired the global trace log. Then forwarded the call to the NLogTraceListener which called DatabaseTarget.Write.
  2. Code running on the 6th thread failed while saving data to the MySql database and the ADO.NET driver tried to log the warning into the System.Diagnostics trace – in order to check the mysql SwitchSource value the switch needed to be initialized (internal switch lock acquired) which required gaining ownership over the global trace lock – BLOCKED by the 7th thread
  3. Code running on the 7th thread failed while saving the log to the MySql database and the ADO.NET driver tried to save the warning into the System.Diagnostics trace – in order to check the mysql SwitchSource value the switch needed to be initialized – BLOCKED by the 6th thread and DEADLOCKED

If the database was responsive the problem probably would not occur as no log from MySql driver would ever be generated. A way to resolve this issue is to disable global locking for trace listeners – this can be achieved through the application config file, eg.:

<configuration>
  <system.diagnostics>
    <trace useGlobalLock="false" />
  </system.diagnostics>
</configuration>

It is safe, because even if this setting is off and the trace listener does not support multi-threading (IsThreadSafe property returns false) the global lock will be used. In our case the NLogTraceListener supports multi-threading so the lock won’t be taken.

I hope you found in this post some useful tips for debugging threading issues in .NET code. If you have any interesting tips on debugging locking issues please share them in comments.


Filed under: CodeProject, Diagnosing threading issues

How to debug Windows Services written in .NET? (part II)

$
0
0

This post is the second and final one dedicated to debugging .NET Windows services (you may read the first one here). The inwrap tool (presented in the first part) is not very friendly to use and I myself haven’t used it since then :) It’s not the best advertisement of someone’s own work, but it did motivate me to write another tool which maybe will gain your interest. The winsvcdiag is a simple application that allows you to debug a start of a Windows service from Visual Studio (or any other debugger – even the remote one).

Debugging a start of a Windows service

The idea is really simple. I again use the Image File Execution Options to hook upon a service executable. Let’s see how this works for a sample TestService which logic is implemented in a testservice.exe executable. First, we need to create a Debugger value under the key HKLM\SOFTWARE\Microsoft\Windows NT\CurrentVersion\Image File Execution Options\testservice.exe. You may either edit the registry manually or use a shortcut:

winsvcdiag --install testservice.exe

Whichever step you take the result should look as on the image below (the path to the winsvcdiag may differ).

regedit-with-hook

From now, when the service is started by the services.exe process, Windows will first run the winsvcdiag.exe passing to it as a first argument the full path to the service executable. Winsvcdiag starts the process, but in a suspended state (using a special flag CREATE_SUSPENDED – the native part is copied from this CodeProject article):

bool success = NativeMethods.CreateProcess(null, sargs, IntPtr.Zero,
                    IntPtr.Zero, false, ProcessCreationFlags.CREATE_SUSPENDED,
                    IntPtr.Zero, null, ref si, out pi);

and then waits in a loop for a debugger to appear:

while (!isDebuggerPresent) {
   ...
   if (!NativeMethods.CheckRemoteDebuggerPresent(pi.hProcess, ref isDebuggerPresent)) {
       failuresCnt++;
       continue;
   }
   Thread.Sleep(1000); // sleep for 1s before the next check
}

As we are not really a debugger we need to disable the hook while we are calling the CreateProcess function, otherwise winsvcdiag will call itself recursively. Now it’s time for you to set a breakpoint in a service initialization code and attach a debugger to the TestService process (it might ran on a remote machine):

attach-to-process

In a moment your breakpoint should be bound and then hit. From now you may debug the service in the usual way. It is very important that you set the breakpoint before attaching to the service process. Otherwise you may miss the method you would like to debug. After you are done with diagnosis uninstall the hook using the –uninstall option – you may always check which hooks are installed with a –list option:

windbgsvc.exe --uninstall testservice.exe

When you debug the start method of a service you don’t have much time – by default the start method should finish within 30s and if it fails to do so it will be killed by the system. As you can imagine 30s usually is not enough to resolve an issue. Fortunately this timeout is configurable in the registry by the ServicesPipeTimeout value under the key HKLM\SYSTEM\CurrentControlSet\Control. It’s a dword which represents time in milliseconds the services.exe will wait for a service to start (it is called a pipe timeout as the services.exe process communicates with its child services using a pipe). Again you may modify the registry manually or use the winsvcdiag.exe – the timeout parameter accepts the time in seconds:

PS > .\winsvcdiag.exe --timeout 120
Timeout changed, but reboot is required for the option to take an effect.
A path to the service exe file must be provided.

A reboot is required for this option to take effect.

What about Topshelf services?

Topshelf is quite restrictive when it comes to its command line parameters. It also checks if its parent process is services.exe and if it is not (which is the case when we start the service from winsvcdiag) it will assume that it is running from the command line. To overcome those restrictions I prepared the Topshelf.Diagnostics Nuget package. It contains an extension method for an improved parsing of the service command line as well as a changed check for the way the service is run (I assume that it’s not a command line mode if it’s run from a session zero). To apply those changes to your service you just need to add two lines to the HostConfigurator initialization:

  private static void Main() {
      HostFactory.Run(hc => {
          ...
          hc.ApplyCommandLineWithDebuggerSupport();
          hc.UseWindowsHostEnvironmentWithDebugSupport();
          ...
      });
  }

The code is available in my dotnet-tools github repo and the binaries can be found here.


Filed under: CodeProject, Diagnosing Applications on Windows

NetExt – SOS on steroids

$
0
0

I have been playing recently with quite a new windbg extension (released by Rodney Viana from Microsoft) called NetExt. Rodney Viana published an introductory post about it, which you may find on his blog. In this post I would like to show you my usage samples as well as encourage you to start using it by yourself. Netext documentation is thorough and nicely organized which is good because at the beginning you probably will spend a lot of time on this page :) In paragraphs that follow I will focus mainly on dump debugging, but most of the techniques presented here should work as well in live debugging sessions.

Finding yourself in a dump

Starting steps depend on the type of diagnosis you need to perform. Though it is almost always worth to know the CLR Runtime version (!wver):

!wver
Runtime(s) Found: 1
0: Filename: mscordacwks_amd64_Amd64_4.0.30319.34209.dll Location: C:\Windows\Microsoft.NET\Framework64\v4.0.30319\mscordacwks.dll
.NET Version: v4.0.30319.34209
NetExt (this extension) Version: 2.0.1.5550

and the Windows version (vertarget and version):

0:000> vertarget
Windows 7 Version 7601 (Service Pack 1) MP (4 procs) Free x64
Product: WinNt, suite: SingleUserTS
kernel32.dll version: 6.1.7601.18869 (win7sp1_gdr.150525-0603)
Machine Name:
Debug session time: Wed Jul  8 12:40:05.000 2015 (UTC + 2:00)
System Uptime: 0 days 4:40:15.908
Process Uptime: 0 days 0:16:10.000
  Kernel time: 0 days 0:00:00.000
  User time: 0 days 0:00:02.000

Information about the debuggee process (such as the command line, environment variables, security context etc.) can be revealed with the help of the !peb command and finally you may list appdomains hosted by this process with !wdomain.

Scanning through threads (exceptions, locks)

Knowing what threads are doing is helpful when you are diagnosing application failures or hangs. To list threads currently running in the application use the !wthreads command. This command will show you also a number of locks acquired by a given thread as well as information about the thread type and the last exception that occurred in it. Example output:

0:000> !wthreads
   Id OSId Address          Domain           Allocation Start:End              COM  GC Type  Locks Type / Status             Last Exception
    1 23e4 0000000001f76e50 0000000001f69720 0000000000000000:0000000000000000 MTA  Preemptive   0 Background
    2 1fc0 0000000001fa9200 0000000001f69720 0000000000000000:0000000000000000 MTA  Preemptive   0 Background|Finalizer
    3 0a3c 0000000001ff8830 0000000001f69720 0000000000000000:0000000000000000 MTA  Preemptive   0 Background|Timer|Worker
    4 2124 0000000001ff9000 0000000001f69720 0000000000000000:0000000000000000 NONE Preemptive   0 Background
    6 0e3c 0000000001ff9fa0 0000000001f69720 0000000000000000:0000000000000000 NONE Preemptive   0 Background|Wait|Worker
    7 ---- 0000000001ffa770 0000000001f69720 0000000000000000:0000000000000000 MTA  Preemptive   0 IOCPort|Worker|Terminated
    8 ---- 0000000001ffaf40 0000000001f69720 0000000000000000:0000000000000000 MTA  Preemptive   0 Worker|Terminated

Next step would be to dump managed stacks for all the running threads ~*e!wclrstack. To dump the exception data use the !wpe command (it requires an exception address, but I’ve already created a pull request to the netext repo so it could also print the current exception in the thread) or !wdae to dump all the exceptions in the heap. Maybe you don’t find those commands very innovative, but in my opinion they produce more readable output than their SOS alternatives. Unfortunately, to diagnose problems with locks you still need to stick to SOS or SOSEX commands (an example of such a diagnosis session can be found in one of my recent posts).

Analyzing the GC heap

The NetExt extension unveils its real power when it comes to the GC heap analysis. Apart from standard commands such as !wdo (dump object), !wclass (dump class definition), !wheap (with interesting switches: -detailsonly, -type {partial-type-name} or -mt) we have at our disposal a heap-query language! To make it work we need to first create a heap index using the !windex command. If our dump file is huge and generating the index takes a lot of time it might be worth to save it (with the -save {file-name} switch) and later load it (-load {file-name}) each time we analyze the dump. !windex command has also an interesting -implement {partial-type-name} switch which dumps all the objects implementing a given type. Finally it has a switch to filter objects by type (-type {partial-type-name}) or method table (-mt {method-table}). With the generated index we are now ready to query our heap. We can start with the basic !wselect, but the most powerful of the NetExt commands is !wfrom. Its syntax is as follows:

!wfrom [/nofield] [/withpointer] [/type <string>]
       [/mt <string>] [/fieldname <string>] [/fieldtype <string>]
       [/implement <string>] [/obj <expr>]
       [where (<condition>)] select <expr1>, ..., <exprN>

There is a big number of functions you may use in the where and select parts and they are all listed in the documentation. Below I present you some example queries to show you how flexible this command is.

Show execution contexts bound to running threads

You may check the SOS way of finding this information in my debug recipe and compare.

> !wfrom -nospace -nofield -type System.Threading.Thread select "System TID: ",
     $thread(DONT_USE_InternalThread), ", Managed TID: ", m_ManagedThreadId, ", address: ", $addr(), ",
     execution context: ", m_ExecutionContext

System TID: #INVALID#, Managed TID: 0n22, address: 0000000100066D48, execution context: 0000000000000000
System TID: 28, Managed TID: 0n23, address: 0000000100068D48, execution context: 0000000000000000
System TID: 29, Managed TID: 0n26, address: 0000000100098E18, execution context: 0000000000000000
System TID: 7, Managed TID: 0n1, address: 00000001FFE674E8, execution context: 00000002FFEB2CD8

Show all recently run SQL queries

List all SQL queries with the addresses of their parameters arrays:

> !wfrom -nospace -nofield -type System.Data.SqlClient.SqlCommand select $addr(),
   ", params: ", _parameters._items._items, ", sql: ", _commandText

00000002000198E8, params: 0000000200019AE0, sql: dbo.TempResetTimeout
00000003000682A8, params: 0000000300068528, sql: SELECT * FROM ttt WHERE category=@category AND parent_id=@parent_id AND (enabled = @enabled Or enabled = 1) ORDER BY sortorder
...

For a given query we may then list its parameter values:

> !wselect _parameterName, _value from 0000000300068528

[System.Data.SqlClient.SqlParameter[]]
***************
[0]: 00000003000683c0
[System.Data.SqlClient.SqlParameter[]]
(string)System.String _parameterName = @category
System.Object _value = 00000000fff0c620 testcat
***************
[1]: 0000000300068568
[System.Data.SqlClient.SqlParameter[]]
(string)System.String _parameterName = @parent_id
System.Object _value = 0000000300068210 5
***************
[2]: 0000000300068678
[System.Data.SqlClient.SqlParameter[]]
(string)System.String _parameterName = @enabled
System.Object _value = 00000000ffeb4950 False

Show all current HTTP requests data

This example is taken from the Rodney’s post:

> !wfrom -nospace -nofield -type *.HttpContext select $rpad($addr(),10)," ",$if(!_thread, "  --",
    $lpad($thread(_thread.DONT_USE_InternalThread),4))," ",$if((_timeoutSet==1),$tickstotimespan(_timeout._ticks),
    "Not set "), " ", $if(_response._completed || _finishPipelineRequestCalled,"Finished",
    $tickstotimespan($now()-_utcTimestamp.dateData)), " ", $replace($lpad(_response._statusCode,8),
    "0n","")," ", $rpad($isnull(_request._httpMethod,"NA"),8), " ", $isnull(_request._url.m_String,
   _request._filePath._virtualPath)

00000000FFF22F80   -- 00:00:00 Finished    200 GET      http://localhost:80/test/WebResource.axd?d=xxxx
0000000100061CE0   -- 00:00:00 Finished    200 GET      http://localhost:80/test/home.aspx

Show all open memory streams

> !wfrom -implement System.IO.MemoryStream where (_isOpen == 1) select $addr()

calculated: 0000000200027E58
calculated: 0000000200209B90
calculated: 000000020021C4A0
calculated: 00000002004FD540
calculated: 00000002004FDE20
calculated: 000000040176E498

6 Object(s) listed
17 Object(s) skipped by filter

Working with GUID/datetime/IP fields

It was always troublesome to display GUID or datetime fields in a readable format. I used to run John Robbin’s scripts to accomplish that. With NetExt you just use one of the available functions, for example to convert datetime ticks to a date use the $tickstodatetime function:

0:007> !wfrom -obj 00000002009df6d8 select $tickstodatetime(dateData)
calculated: 2015-06-02 08:18:25

1 Object(s) listed

For GUIDs use the $toguid function and for IP addresses the $ipaddress function. Other field functions can be found in the documentation.

Misc commands

To make the debugging experience even better some shortcut commands are available:

  • !wruntime to list active HTTP runtimes
  • !whttp – show current HTTP context objects
  • !wcookie – shows current HTTP cookies
  • !wconfig – shows config lines in the memory (useful when the only thing you have is a file dump)
  • !wdict – displays dictionary objects
  • !wkeyvalue – displays objects stored in a NamedValueCollection

Extending

What makes this extension even greater is the fact that its source code is available under the GNU GPLv2 licence. So if you happen to miss some functionality you may implement it by yourself. The setup might require few changes in the project configuration (there are some paths hardcoded and you need to download boost and tinyxml libraries), but it’s nothing too hard – in case you run into problems contact me and I will help you deal with them.

The solution is composed of two projects: a native NetExt and a managed NetExtShim, where NetExt references NetExtShim and at the same time implements interfaces required to talk to the debugger engine (engextcpp.cpp). NetExtShim under the hood uses CLRMD to query the CLR runtime information and exports its managed functions to the native world with the help of the Unmanaged Exports package and COM interoping.


Filed under: CodeProject, Diagnosing Applications on Windows

Diagnosing a Windows Service timeout with PerfView

$
0
0

Today I would like to share with you an interesting (I hope) diagnostics case in one of our system services. The IngestService (that is its name) was not starting properly for the first time – it was being killed because of exceeding the default 30s timeout. But the second try was always successful. No exception was thrown and no logs could be found in the event logs. It’s a situation when ETW traces might shed some light on what’s going on. As it was a .NET service I used PerfView to record the trace file. An important checkbox to select when diagnosing thread wait times is the Thread Time box:

perfview-collect

After collecting the traces on production, I merged them and copied to my developer machine.

Finding yourself in a trace

The first thing I usually check after opening a trace in PerfView is the TraceInfo and Processes views. The TraceInfo view will show you the original system configuration, while the Processes view lists processes which were active while the trace was collected. If your process was not active during the whole trace session it’s worth to note which processes started or ended during the collection. In our case, next to the investigated IngestService, we have WmiAppSrv and dllhost which started during the session:

processes

Going deeper

Let’s start our analysis by opening the Thread Time Stacks view of our trace:

thread-time-stacks

and selecting the IngestService. For the Thread Time analysis PerfView automatically switches to the CallTree tab and this is probably the best place to start. Now, we need to focus on the goal of our investigation. As you remember the service was not starting properly (its startup time was longer than 30s) so we will be interested in the last activities in the process (especially waits). By checking the time range column we can see that all the threads in the process generated events till the end of its live:

time-range

Let’s split the time in half and focus on the second part (we want to know what was the last wait). After expanding the thread nodes we can see that all the threads were BLOCKED (they have some CPU time when the process was killed at the end, but it’s not interesting in our case):

time-range-block

We need to move back and focus on the first half of the session time. And again expand each of the threads and check its last CPU_TIME (the last time it was doing something). It’s hard to compare time ranges when you have a lot of threads and long session time. That’s why, at this point, I usually exclude threads which seem irrelevant and, at the same time, consequently split the time ranges in half, moving from seconds to miliseconds intervals. The final result looks as follows:

final-zoom

Notice we have a BROKEN stack node, but based on the Last and First timestamps and call stacks, we can easily guess which waits are connected. From the screenshot you may see that we are here waiting on some ALPC connection. The full stack looks as follows (I stripped some frames to make the code more compact):

Name
                ...
  |                + MassTransit!ServiceBusFactory.New
  |                 + MassTransit!ServiceBusConfiguratorImpl.CreateServiceBus
  |                  + MassTransit!ServiceBusBuilderImpl.Build
  |                   + MassTransit!ServiceBusBuilderImpl.CreateServiceBus
  |                    + MassTransit!MassTransit.ServiceBus..ctor(class MassTransit.IEndpoint,class MassTransit.IEndpointCache,bool)
  |                     + MassTransit!ServiceBus.InitializePerformanceCounters
  |                      + MassTransit!MassTransit.Monitoring.ServiceBusInstancePerformanceCounters..ctor(class System.String)
  |                       + clr!ThePreStub
                            ...
  |                                + MassTransit!MassTransit.Monitoring.ServiceBusPerformanceCounters..cctor()
  |                                 + MassTransit!MassTransit.Monitoring.ServiceBusPerformanceCounters..ctor()
  |                                  + MassTransit!ServiceBusPerformanceCounters.InitiatizeCategory
  |                                   + System.Core.ni![COLD] System.Linq.Enumerable.Count[System.__Canon](System.Collections.Generic.IEnumerable`1)
  |                                    + System.ni!PerformanceCounterCategory.CounterExists
  |                                     + System.ni!PerformanceCounterCategory.CounterExists
  |                                      + System.ni!PerformanceCounterLib.CounterExists
  |                                       + System.ni!PerformanceCounterLib.CounterExists
  |                                        + System.ni!PerformanceCounterLib.get_CategoryTable
  |                                         + System.ni!PerformanceCounterLib.GetPerformanceData
  |                                          + System.ni!PerformanceMonitor.GetData
  |                                           + mscorlib.ni!RegistryKey.GetValue
  |                                            + mscorlib.ni![COLD] Microsoft.Win32.RegistryKey.InternalGetValue(System.String, System.Object, Boolean, Boolean)
  |                                             + mscorlib.ni!DomainNeutralILStubClass.IL_STUB_PInvoke(Microsoft.Win32.SafeHandles.SafeRegistryHandle, System.String, Int32[], Int32 ByRef, Byte[], Int32 ByRef)
  |                                              + kernel32!RegQueryValueExW
  |                                               + kernel32!LocalBaseRegQueryValue
  |                                                + advapi32!PerfRegQueryValue
  |                                                 + advapi32!QueryExtensibleData
  |                                                  + advapi32!OpenExtObjectLibrary
  |                                                   + WmiApRpl!WmiOpenPerfData
  |                                                   |+ WmiApRpl!WmiAdapterWrapper::Open
  |                                                   | + sechost!OpenServiceW
  |                                                   | + sechost!QueryServiceStatus
  |                                                   |  + sechost!RQueryServiceStatus
  |                                                   |   + rpcrt4!NdrpSendReceive
  |                                                   |    + rpcrt4!NdrSendReceive
  |                                                   |     + rpcrt4!I_RpcSendReceive
  |                                                   |      + rpcrt4!LRPC_CCALL::SendReceive
  |                                                   |       + rpcrt4!LRPC_BASE_CCALL::SendReceive
  |                                                   |        + rpcrt4!LRPC_BASE_CCALL::DoSendReceive
  |                                                   |         + rpcrt4!LRPC_CASSOCIATION::AlpcSendWaitReceivePort
  |                                                   |          + ntdll!ZwAlpcSendWaitReceivePort
  |                                                   |           + ntdll!LdrInitializeThunk
  |                                                   |            + ntdll! ?? ::FNODOBFM::`string'
  |                                                   |             + ntdll!LdrpInitializeProcess
  |                                                   |              + wow64!Wow64LdrpInitialize
  |                                                   |               + wow64!RunCpuSimulation
  |                                                   |                + wow64cpu!ServiceNoTurbo
  |                                                   |                 + wow64!Wow64SystemServiceEx
  |                                                   |                  + wow64!whNtAlpcSendWaitReceivePort
  |                                                   |                   + ntdll!ZwAlpcSendWaitReceivePort
  |                                                   |                    + ntoskrnl!NtAlpcSendWaitReceivePort
  |                                                   |                     + ntoskrnl!AlpcpProcessSynchronousRequest
  |                                                   |                      + ntoskrnl!AlpcpReceiveSynchronousReply
  |                                                   |                       + ntoskrnl!AlpcpSignalAndWait
  |                                                   |                        + ntoskrnl!KeWaitForSingleObject
  |                                                   |                         + ntoskrnl!KiCommitThreadWait
  |                                                   |                          + ntoskrnl!KiSwapContext
  |                                                   |                           + ntoskrnl!SwapContext_PatchXRstor
  |                                                   |                            + BLOCKED_TIME
  |                                                   |                            + CPU_TIME

Finding the cause

So the origin of the wait is in the MassTransit library, in the InitiatizeCategory method of the ServiceBusPerformanceCounters class. Let’s have a look at it:

// MassTransit.Monitoring.ServiceBusPerformanceCounters
private void InitiatizeCategory()
{
	try
	{
		RuntimePerformanceCounter[] source = new RuntimePerformanceCounter[]
		{
			this.ConsumerThreadCount,
			this.ReceiveThreadCount,
			this.ReceiveRate,
			this.PublishRate,
			this.SendRate,
			this.ReceiveCount,
			this.PublishCount,
			this.SentCount,
			this.ConsumerDuration,
			this.ConsumerDurationBase,
			this.ReceiveDuration,
			this.ReceiveDurationBase,
			this.PublishDuration,
			this.PublishDurationBase
		};
		if (!PerformanceCounterCategory.Exists("MassTransit"))
		{
			PerformanceCounterCategory.Create("MassTransit", "MassTransit Performance Counters", PerformanceCounterCategoryType.MultiInstance, new CounterCreationDataCollection((from x in source
			select x).ToArray<CounterCreationData>()));
		}
		else
		{
			int num = (from counter in source
			where !PerformanceCounterCategory.CounterExists(counter.Name, "MassTransit")
			select counter).Count<RuntimePerformanceCounter>();
			if (num > 0)
			{
				PerformanceCounterCategory.Delete("MassTransit");
				PerformanceCounterCategory.Create("MassTransit", "MassTransit Performance Counters", PerformanceCounterCategoryType.MultiInstance, new CounterCreationDataCollection((from x in source
				select x).ToArray<CounterCreationData>()));
			}
		}
	}
	catch (SecurityException)
	{
		string obj = "Unable to create performance counter category (Category: {0})\nTry running the program in the Administrator role to set these up." + ExtensionsToString.FormatWith("\n**Hey, this just means you aren't admin or don't have/want perf counter support**", new object[]
		{
			"MassTransit"
		});
		ServiceBusPerformanceCounters._log.Warn(obj);
	}
}

We can see that it intializes some Performance Counters which are used to monitor the MassTransit client. But still we don’t know why the method took so long. We know however that there was some ALPC connection in the background. Let’s see in the Events view in PerfView if we have any ALPC traces in this time range:

services-wait

So there was one open client connection coming from our IngestService (which never ended – no RpcClientCall/Stop event could be found with the activity id: 03b984af-47ba-4434-a6df-522edf9c1b42). We can also see that there was an ALPC connection on the server side (activity id: 10b92075-ac49-4423-964d-c944a0f680a0), probably triggered by our client connection, which lasted for 27 seconds! By the time it ended there was no IngestService running. It’s time to analyze what services.exe process was doing in this period of time. Let’s open the Thread Time (with ReadyThread) view, choose services (460) process and set the time range to 18,658.365 – 46,503.131. Then expand the threads and find the ones which were blocked almost all that time. I quickly found a thread 4004 which was trying to start a service, but needed to wait on some critical section. I could also see that this thread was readied by a thread 4904 and then started a new process:

thread-4004

What was the thread 4904 doing at this time:

thread-4904

What was the process name which was started by the 4004 thread? You can sroll up to the beginning of the post, check the start time of the WmiApSrv process and you already know the answer.

Now, everything is clear. Our IngestService, while starting, requested some performance data. To provide this data system needed to start the WMI Performance Adapter (WmiApSrv) service. It seems that at a given moment only one service could be starting (unless it’s a dependent service) and there is a critical section ensuring that. Finally we ended in a classical deadlock situation: the IngestService was waiting for the WmiApSrv to collect some performance data, while WmiApSrv was unable to start because the IngestService was starting.

Solution

After this investigation the solution was simple: we just added WmiApSrv as a dependant service to the IngestService.

PerfView issue

If you are not using US locales on your system it is very probable that selecting date ranges won’t work for you in PerfView. I have Polish locales and needed to modify PerfView binaries in order to set an invariant culture when the application starts (I wrote to Vance Morrison about this issue but haven’t got yet any answer). Contact me if you run into this problem and I will help you.


Filed under: CodeProject, Profiling .NET applications

Understanding the Thread Time view in PerfView

$
0
0

Recently while examining a slow request issue (I have a plan to describe this investigation in a seperate post) it came to me that every time I open the Thread Time view it takes a moment to understand what this view actually contains. I decided to write this post for me and for any of you who share the same feeling about this window :).

The Thread Time view is the most detailed of PerfView views when it comes to analysing CPU spikes and thread wait times. It’s not the view you open first as you will quickly find yourself lost with the amount of data presented there. I usually start the thread time analysis with pinpointing the interesting periods of time when my application was running. For this purpose you may either use any of the special views, such as the Server Request Thread Time Stacks view or the ASP.NET Thread Time view, or find events interesting to you in the Events view. For instance in my diagnostics case (disassembling a request) I used the Windows Kernel/TcpIp/Accept and Windows Kernel/TcpIp/Disconnect events to set a time range for my further investigations. But in this post we will examine only 2ms of the request time (full analysis should be available soon). Let’s open the Thread Time view and set the Start and End input boxes to accordingly: 9,330.058 and 9,333.001. Now switch to the CallTree tab and start expanding each thread node under your selected process. Most of them will probably have the BLOCKED status (as you can see on the print screen below) which means they weren’t doing anything all this time:

blocked-threads

You may safely exclude them from the view (Alt+E on the thread node). You should be left with threads that have some interesting call stacks. In my case in the selected period of time there were only two threads active in the process: 5760 and 7260. We will focus on the first one. After expanding all the call stacks I got the following data (I replaced the irrelevant lines with dots):

  Process32 w3wp (3736)
  + Thread (5760) CPU=7ms (.NET ThreadPool)
  ...
  Name                                                                     First       Last
  + nancy!ModuleExtensions.Bind                                            9,330.057  9,331.099
  | + Nancy!DynamicModelBinderAdapter.TryConvert                           9,330.057  9,331.099
  |  + Nancy!DefaultBinder.Bind                                            9,330.057  9,331.099
  |   + Nancy!DefaultBinder.DeserializeRequestBody                         9,330.057  9,331.099
  |    + Nancy!JsonBodyDeserializer.Deserialize                            9,330.057  9,331.099
  |     + mscorlib.ni!StreamReader.ReadToEnd                               9,330.057  9,331.099
  |      + mscorlib.ni!StreamReader.ReadBuffer                             9,330.057  9,331.099
  |       + Nancy!RequestStream.Read                                       9,330.057  9,331.099
  |        + Microsoft.Owin.Host.SystemWeb!DelegatingStream.Read           9,330.057  9,331.099
  |         + System.Web.ni!HttpBufferlessInputStream.Read                 9,330.057  9,331.099
  |          + System.Web.ni!IIS7WorkerRequest.ReadEntityBody              9,330.057  9,331.099
  |           + System.Web.ni!IIS7WorkerRequest.ReadEntityCoreSync         9,330.057  9,331.099
  |            + System.Web.ni!DomainBoundILStubClass.IL_STUB_PInvoke(...  9,330.057  9,331.099
  |             + webengine4!MgdReadEntityBody                             9,330.057  9,331.099
  |               + ...                                                    9,330.057  9,331.099
  |                 + ntoskrnl!NtWaitForSingleObject                       9,330.057  9,331.099
  |                  + ntoskrnl!KeWaitForSingleObject                      9,330.057  9,331.099
  |                   + ntoskrnl!KiCommitThreadWait                        9,330.057  9,331.099
  |                    + ntoskrnl!KiSwapContext                            9,330.057  9,331.099
  |                     + ntoskrnl!SwapContext_PatchXRstor                 9,330.057  9,331.099
1#|                      + BLOCKED                                         9,330.057  9,330.663
2#|                      + CPU_TIME                                        9,330.663  9,331.099
  + LowLevelDesign.Diagnostics.LogStore.ElasticSearch!ElasticSearchAppC... 9,331.728  9,332.373
  |                    + ...                                               9,331.728  9,332.373
3#|                      + CPU_TIME                                        9,331.728  9,332.373
  + FluentValidation!FluentValidation.AbstractValidator`1[...].Validate    9,331.099  9,331.728
  |                    + ...                                               9,331.099  9,331.728
4#|                      + CPU_TIME                                        9,331.099  9,331.728

Notice the left margin and four marks on it – I will be referring to them later on. By checking the time ranges on the right we can see that everything starts at 9,330.057ms. Firstly, the thread is blocked (mark 1#) till 9,330.663ms. The call stack for the BLOCKED event shows what the thread was doing at the moment it got suspended.. Now, we have some CPU_TIME, split in three time ranges:

  • from 9,330.663ms till 9,331.099ms (mark 2#)
  • from 9,331.099ms till 9,331.728ms (mark 4#)
  • from 9,331.728ms till 9,332.373ms (mark 3#)

As you can see in the code snippet, lines are not sorted chronologically – mark 4# comes before 3# and you should check the When column to see which moment comes first, eg.:

  |When                                 First	    Last
2#| AAAAAA9AAAA3____________________    9,330.057   9,331.099
3#| __________________8AAAAAA1______    9,331.728   9,332.373
4#| ___________6AAAAAA1_____________    9,331.099   9,331.728

Now the question is how to interpret those call stacks? Before we answer this question let’s first understand how PerfView builds the Thread Time view. As you know, ETW tracing is just a process of collecting events from different providers. Views available in PerfView (or WPA) are just nice ways to display these collected events. The Thread Time view is not an exception and it is built upon the following events:

  • Windows Kernel/Thread/CSwitch – event generated each time a thread is given CPU time (CPU switches from one thread to the other)
  • Windows Kernel/PerfInfo/Sample – event generated every millisecond to collect stack traces of processes running on each processor on the system

Let’s open the Events view, set the time range to 9,330.058ms9,333.001ms, choose our process and select the above mentioned events from the event list. We will receive the following records (I formatted them for better readability):

Event#1
Event Name:   Windows Kernel/Thread/CSwitch
Time MSec :   9,331.778
Process Name: w3wp (3736)
Rest:         HasStack="True" ThreadID="5,760" OldThreadID="7,256" OldProcessID="3,736" OldProcessName="w3wp" NewThreadID="5,760" NewProcessID="3,736" NewProcessName="w3wp" ProcessorNumber="0" NewThreadPriority="8" OldThreadPriority="9" NewThreadQuantum="0" OldThreadQuantum="0" OldThreadWaitReason="15" OldThreadWaitMode="Swappable" OldThreadState="Wait" OldThreadWaitIdealProcessor="0" NewThreadWaitTime="0"

Event#2
Event Name:   Windows Kernel/PerfInfo/Sample
Time MSec :   9,332.100
Process Name: w3wp (3736)
Rest:         HasStack="True" ThreadID="5,760" InstructionPointer="0xfffff800019c7bf0" ProcessorNumber="0" Priority="0" ExecutingDPC="False" ExecutingISR="False" Rank="0" Count="1"

Event#3
Event Name:   Windows Kernel/Thread/CSwitch
Time MSec :   9,332.373
Process Name: w3wp (3736)
Rest:         HasStack="True" ThreadID="1,244" OldThreadID="5,760" OldProcessID="3,736" OldProcessName="w3wp" NewThreadID="1,244" NewProcessID="3,736" NewProcessName="w3wp" ProcessorNumber="0" NewThreadPriority="9" OldThreadPriority="8" NewThreadQuantum="0" OldThreadQuantum="0" OldThreadWaitReason="32" OldThreadWaitMode="Swappable" OldThreadState="Ready" OldThreadWaitIdealProcessor="0" NewThreadWaitTime="452"

Now, everything becomes clear. We have two context switches and we can see that the first switch, at 9,331.778ms, (Event#1) activated our 5760 thread (NewThreadID) and it was active till 9,332.373ms (Event#3) when system scheduler suspended it and switched the first CPU to a thread 1244 (NewThreadID). In the meantime one profiling event was recorded at 9,332.100ms which proves that the thread was running on the first processor.

With all the collected data we can summarize the 2ms of the 5760 thread lifetime in the following table:

Time Description
9,331.778ms The thread was awakened by the system after the request stream was received and started doing something (we don’t know what)
9,332.100ms The thread was performing some requests in the ElasticSearch log store (the stack is from my code so I know :))
9,332.373ms The thread was doing validations (FluentValidation.AbstractValidator`1.Validate) when it was put on hold by the system.

As you can see much happens on your system in every millisecond and collecting ETW traces is one of the best ways to understand exactly what is keeping your CPU cores busy :)


Filed under: CodeProject, Diagnosing threading issues

Hidden catch when using linked CancellationTokenSource

$
0
0

Today’s short post was inspired by a recent memory leak in Nancy. I thought it’s worth to describe it in detail as the reason why the memory was leaking was not so obvious and many of us could commit the same mistake as Nancy authors. The leak was present in the NancyEngine class, which is the central point in the Nancy request handling process. In other words: each request served by the Nancy application must pass through this class instance. NancyEngine processes the requests asynchronously and accepts as a parameter a CancellationToken instance – thus making it possible to cancel the request from the “outside”. At the same time it uses an internal CancellationTokenSource instance which cancels the current requests when the engine is getting disposed. As you see there are two cancellation tokens involved and the HandleRequest method needs to respect their statuses. For such an occasion there is a method in the CancellationTokenSource class in .NET Framework which creates for you a special “linked” CancellationTokenSource that will depend on values in the related tokens. From now on you don’t need to worry about the other tokens as whenever they get cancelled your linked token will become cancelled too. With this introduction the prologue of the HandleRequest becomes clear:

public Task<NancyContext> HandleRequest(Request request, Func<NancyContext, NancyContext> preRequest,
        CancellationToken cancellationToken)
{
    var cts = CancellationTokenSource.CreateLinkedTokenSource(
            this.engineDisposedCts.Token, cancellationToken);
    ...
    // cts.Token used
}

Let’s leave Nancy for a second and focus on the cancellation tokens. Have a look at the following XUnit test and guess whether it will pass or fail:

[Fact]
public static void RunCancellableTask()
{
    WeakReference wref = null;
    M1(ref wref);
    GC.Collect();

    Assert.False(wref.IsAlive);

    var cts1 = new CancellationTokenSource();
    var cts2 = new CancellationTokenSource();
    M2(ref wref, cts1.Token, cts2.Token);
    GC.Collect();

    Assert.False(wref.IsAlive);
}

private static void M1(ref WeakReference wref)
{
    var cts = new CancellationTokenSource();
    wref = new WeakReference(cts);
    Task.Delay(1000).Wait(cts.Token);
}

private static void M2(ref WeakReference wref, CancellationToken token1, CancellationToken token2)
{
    var cts = CancellationTokenSource.CreateLinkedTokenSource(token1, token2);
    wref = new WeakReference(cts);
    Task.Delay(1000).Wait(cts.Token);
}

Well, it will fail on the second assert. Now the question is why the first cancellation token (from the M1 method) got disposed and the second one (from the M2 method) not. Let’s stop on the second assert and check who keeps references to the wref.Target:

cancel-tokens

As you can see the linked CancellationTokenSource hasn’t been reclaimed as there are references to it from the callbacks arrays in the linked CancellationTokens. This reveals the mechanism upon which linked tokens are built. When you create a linked CancellationTokenSource it initiates internally a new CancellationToken and registers a callback method for each of the linked tokens. In this callback method it cancels its internal token whenever any of the other tokens gets cancelled. As we now know what is the leak source let’s see how it can be fixed. Nancy authors already did that in the 1.4.2 version of the Nancy framework:

public Task<NancyContext> HandleRequest(Request request, Func<NancyContext, NancyContext> preRequest,
        CancellationToken cancellationToken)
{
    using (var cts = CancellationTokenSource.CreateLinkedTokenSource(
            this.engineDisposedCts.Token, cancellationToken)) {
        ...
        // cts.Token used
    }
}

That’s it. When linked CancellationTokenSource is getting disposed it unregisters itself from the linked tokens callbacks tables and no leak is present. To conclude: always dispose CancellationTokenSource instances when you are done using them.


Filed under: Diagnosing .NET code
Viewing all 59 articles
Browse latest View live


Latest Images